Artificial Intelligence
How to scale sentiment analysis using Amazon Comprehend, AWS Glue and Amazon Athena
Today consumers are encouraged to express their satisfaction or frustration with a company or product through social media, blogs, and review platforms. Sentiment analysis can help companies better understand their customers’ opinions and needs and make more informed business decisions. Amazon released a dataset to the public with over 130 million product reviews in multiple categories and languages. We’ll use this dataset for our use case.
In this post you’ll learn how to build a serverless data processing pipeline that consumes raw Amazon product reviews from Amazon S3, clean the dataset, extract sentiment from each review, and write the output back to Amazon S3. Then we’ll explore and visualize the final result. We want to highlight the ways in which data can be enriched with cloud-based machine learning APIs as well as any other API you choose. The flexibility is built right into the pipeline.
Amazon Comprehend uses machine learning to find insights and relationships in text. In our use case, we’ll use Amazon Comprehend to determine sentiment from customer product reviews. Even with easy to use APIs, our raw dataset needs to be cleaned and review text extracted before we can derive meaningful insight. For that purpose we will use AWS Glue a fully managed, serverless extract, transform, and load (ETL) service leveraging the power of Apache Spark. Lastly we’ll use Amazon Athena and Amazon QuickSight to query and visualize the results.
Data pipeline architecture
Our use case is simple, but you can easily extend it to fit more complex scenarios. We start off with raw data and we want to enrich all of it in one shot. A batch ETL process is ideal in this case.
The following diagram shows our processing pipeline architecture:

We start off by running a Glue ETL job that reads (1) the raw Amazon product reviews dataset from Amazon S3 in Apache Parquet format. The ETL calls the Comprehend API (2) for each review row to extract the sentiment. The output of the ETL job is a set of files stored on Amazon S3 (3) also in Apache Parquet format and partitioned by product category, including the sentiment value for each product review. We then create a crawler (4) to discover the newly created dataset and update the AWS Glue Data Catalog accordingly. Finally, we log into Amazon QuickSight (5) and create our visualizations backed by the Amazon Athena query engine. Pretty simple.
Throughout the blog post I will share and discuss code snippets as they relate to different tasks in the ETL job. For reference, you can also find the complete AWS Glue ETL script here.
Understanding the data
Before we do anything we need to understand the data. The documentation mentions that the data is available in tab-separated (TSV) and Apache Parquet file formats. Parquet is more efficient and for that reason we’ll be using it in this blog post. The Parquet data is also partitioned by product_category, which makes it more efficient to use when reading reviews specific to some product categories rather than all of them. In Apache Spark, which AWS Glue uses, it’s simple to read the data, like this:
If we were to explore the data we would see the following:

Preparing the data
To use the Amazon Comprehend API for sentiment analysis we need to provide it with either an individual string to extract sentiment, or we can use the bulk API that takes up to 25 strings at a time. We have a lot of data, so the bulk API is a better choice.
Before we get into the logic of splitting up the dataset we need to do some clean up. To do that we add a column named body_len that includes the length of the review body text. We then filter out all reviews that are under 10 characters and over 5000 characters, the Amazon Comprehend max character length. You can change this logic as you see fit. We can further limit the number of rows to be processed based on our requirements. Finally, we get the number of rows from the cleaned dataframe.
The logic for splitting up the rows into groups of 25 is fairly simple, with a caveat.
As you can see from this code, we’re asking Spark to break up the rows into 1000 / (4 * 25) = 10 partitions. Each partition will have 100 rows. You’re probably asking, “Why 100 and not 25?” Doesn’t Amazon Comprehend take only 25 strings at a time? By creating groups that are divisible by 25 we can reduce the number of calls Spark needs to make to the user-defined function that interfaces with Amazon Comprehend. The other benefit is that we reduce overhead by introducing batching. (The caveat that I mentioned earlier concerns the overhead of having many more rows to transform. If you simply divide the row count by 25, it will result in too many partitions, which would cause the Spark driver to throw an out-of-memory exception.)
In the next code block we iterate over each row and extract only the review ID and body since we don’t care about the rest of the data at this stage. Additionally, we use the glom() function which concatenates all rows of a given Spark partition together into an array resulting in a single row containing a list of 100 ID, Body tuples.
Sentiment analysis
Now we’re at the point where we need to define a function that will take each group of review IDs and bodies, call the Amazon Comprehend API, and return sentiment values.
Let’s look at the User Defined Function (UDF) that interfaces with Amazon Comprehend.
To help readability and later conversion to DataFrame we declare a Row class that we’ll use when returning the sentiment results. Jumping into the UDF, we extract all of the review body text into the bodies list variable. We then iterate over the list of strings creating sub-lists of 25 strings each, up to the number of batches we’ve selected. We then call the Amazon Comprehend batch_detect_sentiment API for each list of 25 and process the results, returning a list of review IDs and corresponding sentiment value.
This leads us to the next line of code that executes the UDF for each row:
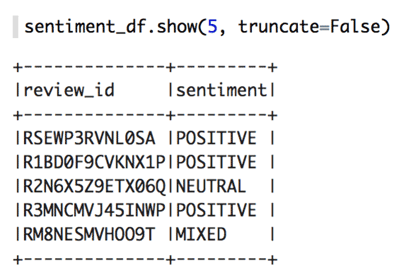
The output looks something like this:

I want to add that, as with any API, there is a rate limit to consider. For BatchDetectSentiment the rate limit is 10 requests per second. When processing a lot of data in parallel you will quickly hit this limit. To deal with the limit you need to introduce a mechanism to control how frequently you call the API. I’ve included the code in the ETL script to show you how to do that, but I won’t explain it further in this post.
Combining the results
Next we need to join the sentiment results from the previous step with the original list of product reviews.
This line of code takes the original reviews DataFrame and joins it with the sentiment DataFrame containing review IDs and sentiment values. Note that after the join we’ll end up with two review_id columns, so we’ll need to drop one.
The last step is to write the data out to Amazon S3 so that we can explore it using Amazon Athena and Amazon QuickSight.
This line of code does the trick:
This code does a few things, first we call the write method followed by partitionBy. partitionBy is important because it lets us divide up the dataset by the partitioned-by column resulting in Spark creating prefixes (folders) on Amazon S3 for each value in this column. In our case we use the product_category. Many times you would want to use a date field or another column with low cardinality to partition your data. On Amazon S3 the path would look something like this:
Later on, in Athena, when we query the data we can use a WHERE clause on the product_category column to select only data that exist in this particular folder. This avoids scanning other data, which results in performance boost and less money spent per query.
The last piece of the code sets the output mode to overwrite, which will overwrite the entire dataset every time it is run. You can also set it to append. Then we write the data out in columnar Parquet format compressed with Snappy (the default compression for Parquet).
Visualizing the data
Before we can query and visualize our data we need to update the AWS Glue Data Catalog with the new table information. We’ll use the AWS Glue Crawler to automatically discover the schema and update the AWS Glue Data Catalog.
Open the AWS Glue console and select Crawlers from the left navigation pane. Add a new crawler and give it a name. Next, in the Include Path field specify the S3 path to your Parquet data that we outputted in the previous section. In the Exclude Patterns field add the following two patterns:
- _metadata
- _common_metadata
Choose Next, and when asked to add another data store leave it on No and choose Next. Select an existing IAM role or create a new one and choose Next. You can leave the Frequency as Run on demand because we’ll run this only once. However, in a production environment you might want to schedule your crawlers to run at regular intervals so that they can keep metadata fresh in the AWS Glue Data Catalog. On the next page in the console you are asked to select or create a Database to keep tables created by the crawler. Go ahead and create one or use the default. Additionally, you can give your table name a Prefix since table names are generated for you to avoid possible name collisions. Finally, click Next, and then Finish.
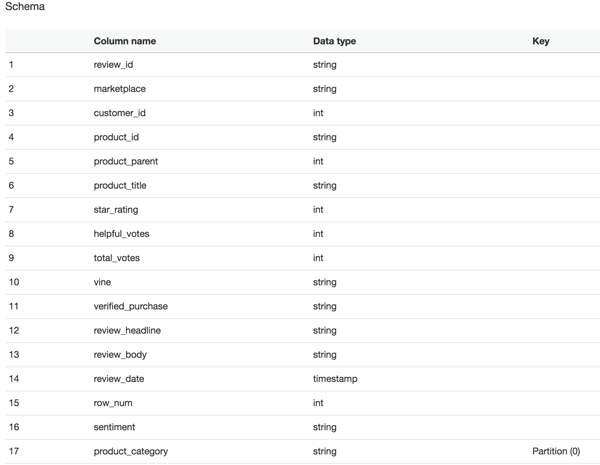
Put a check mark next to your crawler in the main crawler window and choose Run Crawler. After the crawler completes its task you’ll have a new table in your Data Catalog. It should look something like this:

Lets switch over to the Amazon Athena console and explore our data.
Enter the following SQL statement in the editor window in Athena. Make sure to change the database name (mine is amazon) and table name (mine is reviews_sentiment) to values that you’ve used.
As you can see from the results, the overwhelming sentiment in product reviews for apparel is positive with a significant number of votes.

If you paid close attention you might have noticed the runtime statistics Athena reports: Run time: 0.98 seconds, Data scanned: 0KB (your numbers may vary). Particularly interesting is the amount of data scanned. This is a benefit of using the Parquet columnar file format. Parquet calculates several statistics such as count and min and max values for each column it stores. This allows Athena to return results for certain aggregation functions without ever needing to read column data. Pretty neat. By the way, don’t worry if your query returns different result values because the rows your script processed may differ from mine.
Now that we know we have good data, let’s switch to the Amazon QuickSight console and visualize it.
If you’ve never used Amazon QuickSight, follow this link to get set up.
After you’ve opened the Amazon QuickSight console, choose New Analysis and then New Data Set from the top left corner of the page. Select Amazon Athena from the list of available data sources and give your source a name, any name, and choose Create Data Source. Next, select your database and table name that we previously created using the crawler. On the next page, you are asked if you want to use SPICE, the Amazon QuickSight ultra-fast cache, or if you want to query data directly from Athena every time. For our purposes we’ll select Directly query your data, but for heavy workloads using SPICE is highly recommended. Choose Visualize.
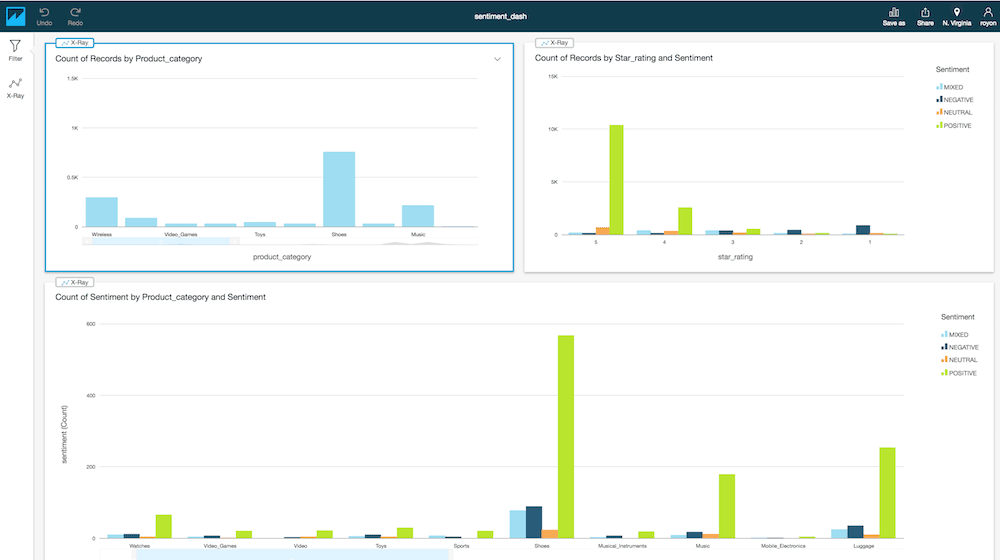
Here is a simple dashboard I’ve created:

Conclusion
At this point, you should be able to explore and visualize the data in whichever way you like. What should be clear from this blog post is the way in which we constructed a data processing workflow using serverless technologies to clean, transform, enrich, query, and visualize large amounts of data quickly.
Additionally, the method in which we were able to enrich our large dataset with Amazon Comprehend, the AWS NLP service, directly in our ETL job demonstrates a powerful pattern. This pattern can be applied to any AWS service, as well as other services, provided that the appropriate SDK is used. Although less user friendly, it’s also possible to simply call a service’s REST API directly if an SDK is not available. Another useful pattern I’ve learned by putting this pipeline together is that Amazon Athena comes in really handy when I need to inspect data because it is persisted to Amazon S3 at different stages of the pipeline.
About the Author
 Roy Hasson is a Global Business Development Manager for AWS Analytics. He works with customers around the globe to design solutions to meet their data processing, analytics and business intelligence needs. Roy is big Manchester United fan cheering his team on and hanging out with his family.