.NET on AWS Blog
Developing Custom Processors using OpenTelemetry in .NET 8
Introduction
In the ever developing landscape of modern software development, observability has emerged as a crucial aspect of building and maintaining robust applications. OpenTelemetry, a Cloud Native Computing Foundation (CNCF) project, provides a vendor-neutral set of APIs, libraries, and tools for generating and managing telemetry data, including metrics, logs, and traces.
One of the powerful features of OpenTelemetry is its ability to create custom processors, enabling developers to transform and enrich telemetry data according to their specific needs.
In this blog post, we’ll explore how to develop a custom processor using OpenTelemetry in the .NET ecosystem.
What are Processors in OpenTelemetry
Processors in OpenTelemetry are components that modify telemetry data before it is exported to backend or other processing pipelines. They allow developers to perform various operations on the data, such as filtering, enriching, or transforming it based on specific criteria or business requirements. Processors can be chained together, enabling complex processing pipelines tailored to the needs of an application.
Why Create Custom Processors
While OpenTelemetry provides a set of built-in processors, there are scenarios where these processors do not fully meet the specific requirements of an application. Custom processors offer the flexibility to extend OpenTelemetry’s capabilities and adapt the telemetry data processing to fit unique use cases. Some common reasons for creating custom processors include:
- Data Enrichment: Adding application-specific metadata or context to telemetry data, such as user information, environment details, or custom tags.
- Data Transformation: Modifying the structure or format of telemetry data to align with backend requirements or internal standards.
- Data Filtering: Selectively including or excluding telemetry data based on specific criteria, such as trace sampling or log level filtering.
- Data Redaction: Removing sensitive information from telemetry data to ensure compliance with privacy regulations or security policies.
Developing a Custom Processor in .NET
To illustrate the process of creating a custom processor in .NET, let’s consider an example scenario where we want to enrich trace data with additional context, such as the application version and deployment environment. Sample application code is shared on GitHub at aws-samples/dotnet-opentelemetry-samples.
Step 1: Install the Required NuGet Packages
First, we need to install the necessary NuGet packages for Open Telemetry in our .NET project:
dotnet add package OpenTelemetry
dotnet add package OpenTelemetry.Exporter.Console
Step 2: Define the Custom Processors
Next, we create a new class that implements the BaseProcessor<T> abstract class from the OpenTelemetry namespace. In this example, we’ll create a custom processor for traces:
using OpenTelemetry;
using OpenTelemetry.Logs;

namespace SampleApi.Processors
{
    public class EnrichLogsWithUsernameProcessor : BaseProcessor<LogRecord>
    {
        private readonly string name;
        private readonly IHttpContextAccessor _httpContextAccessor;

        public EnrichLogsWithUsernameProcessor(IHttpContextAccessor httpContextAccessor, string name = "EnrichLogsWithUsernameProcessor")
        {
            this.name = name;
            _httpContextAccessor = httpContextAccessor;
        }

        public override void OnEnd(LogRecord record)
        {
            var username = _httpContextAccessor?.HttpContext?.User?.Identity?.Name;
            record.Attributes = record!.Attributes!.Append(new KeyValuePair<string, object>("Username", string.IsNullOrEmpty(username) ? "Anonymous" : username)).ToList();
        }
    }
}
In this example, the EnrichLogsWithUsernameProcessor class inherits from BaseProcessor<LogRecord>, which means it will process all logs records. The class takes one constructor parameter: IHttpContextAccessor. Http Context is used to extract the user identity and we add the name of the user to each LogRecord, if user identity is null, then we add Anonymous in the username in the LogRecord indicating that the particular call wasn’t authenticated.
The OnEnd method is overridden to enrich the Log record with the provided context information, this method is called synchronously when a telemetry object is ended.
You could override OnStart method depending upon the use case, for e.g. The OnStart method is called when a telemetry object is started so it’s an ideal place if you want to filter something.
We create another processor to log exception stack trace in case of an exception:
using OpenTelemetry;
using OpenTelemetry.Logs;
using System.Linq;

namespace Amazon.Observability.Processors
{
    internal class LogExceptionStackTraceProcessor : BaseProcessor<LogRecord>
    {
        private readonly string name;

        public LogExceptionStackTraceProcessor(string name = "LogExceptionStackTraceProcessor")
        {
            this.name = name;
        }

        public override void OnEnd(LogRecord record)
        {
            if (record.Exception != null)
            {
                record.Attributes = record!.Attributes!.Append(new KeyValuePair<string, object?>("exception.stacktrace", record!.Exception!.StackTrace)).ToList();
                record.Attributes = record!.Attributes!.Append(new KeyValuePair<string, object?>("exception.innerexception", record!.Exception!.InnerException!)).ToList();

            }
        }
    }

}
The LogExceptionStackTraceProcessor class inherits from BaseProcessor<LogRecord> similar to previous processor. The includes the stack trace in the logs if there is an exception in the Log record object.
Step 3: Configure the Processing Pipeline
To incorporate the custom processor into the Open Telemetry processing pipeline, we need to configure it in our application startup e.g., Program.cs in an ASP.NET Core application:
builder.Services.AddHttpContextAccessor();
builder.Logging.ClearProviders();
builder.Logging.AddOpenTelemetry(options =>
{
    options
        .SetResourceBuilder(
            ResourceBuilder.CreateDefault()
                .AddService("SampleApiService"))
                .AddProcessor(new EnrichLogsWithUsernameProcessor(new HttpContextAccessor()))
                .AddProcessor(new LogStackTraceExceptionProcessor())
                .AddConsoleExporter();
});
In this code snippet, we configure Open Telemetry logging by calling AddOpenTelemetry method and add the custom EnrichLogsWithUsernameProcessor to the processing pipeline, passing in the HttpContextAccessor object as argument. We also add another custom process which includes the stack trace along with the exception.
With this configuration, any log generated by our application will be enriched with the additional context information before being exported to the console or wherever logs are being exported.
Step 4: Generate and Observe Logging Data
Finally, we can generate logs with our application code and observe the enriched data in the console output. You can run the application locally to observe the logs in the console.
using Microsoft.AspNetCore.Mvc;

namespace SampleApi.Controllers
{
    [ApiController]
    [Route("[controller]")]
    public class WeatherForecastController : ControllerBase
    {
        private static readonly string[] Summaries = new[]
        {
            "Freezing", "Bracing", "Chilly", "Cool", "Mild", "Warm", "Balmy", "Hot", "Sweltering", "Scorching"
        };

        private readonly ILogger<WeatherForecastController> _logger;

        public WeatherForecastController(ILogger<WeatherForecastController> logger)
        {
            _logger = logger;
        }

        [HttpGet(Name = "GetWeatherForecast")]
        public IEnumerable<WeatherForecast> Get()
        {
            _logger.LogInformation("Weather Forecast Get API call");

            var forecast =  Enumerable.Range(1, 5).Select(index =>
                new WeatherForecast
                (
                    DateOnly.FromDateTime(DateTime.Now.AddDays(index)),
                    Random.Shared.Next(-20, 55),
                    Summaries[Random.Shared.Next(Summaries.Length)]
                ))
                .ToArray();
            return forecast;
        }

    }
}
When we run the application and make the API call, we see logs similar to the following in the console output:
{
    "body": "Weather Forecast Get API call",
    "severity_number": 9,
    "severity_text": "Information",
    "trace_id": "f18110933d85d8d6ea326ad2b16bee73",
    "span_id": "e3b551998393564b",
    "attributes": {
        "ProcessorName": "LogEnrichProcessor",
        "Username": "Anonymous"
    },
    "scope": {
        "name": "SampleApi.Controllers.WeatherForecastController"
    },
    "resource": {
        "service.instance.id": "f27d1248-8cb1-4aeb-ada2-3eaa0dc08122",
        "service.name": "SampleApiService",
        "telemetry.sdk.language": "dotnet",
        "telemetry.sdk.name": "opentelemetry",
        "telemetry.sdk.version": "1.8.0"
    }
}
The logs now includes the additional Username attribute with the value we provided in the custom processor.
Step 5: Deploying the application on ECS Fargate
In order to test the custom processors, we are going to deploy the sample API application available on GitHub on an Amazon ECS container which is accessible through an Application Load Balancer. In addition, we will set up an extra container, the AWS Distro for OpenTelemetry (ADOT) collector, which offers a secure and production-ready solution for collecting and sending distributed logs, traces, and metrics to various AWS monitoring tools. For more information, see AWS Distro for OpenTelemetry.
The deployment involves these steps:
- Building a docker image
- Pushing the docker image to Amazon Elastic Container Registry (ECR)
- Creating an ECS task definition
- Setting up an ECS cluster
- Configuring an ECS service
- Configuring load balancer along with target groups.
Clone the GitHub repository
git clone https://github.com/aws-samples/dotnet-opentelemetry-samples.git
Build a docker image and push to ECR
In the sample API we have already included a Dockerfile which can be used to build a docker image.
Run the following commands to build a docker image,
cd dotnet-opentelemetry-samples/SampleAp
docker build -t dotnetapi .
Create an ECR repository and push the docker image
To push the docker image to ECR repository, see how to push an image to ECR.
Create and store ADOT collector configuration in AWS Systems Manager Parameter Store
1) The ADOT collector configuration YAML file is a configuration file that defines how the ADOT collector should process and export telemetry data (logs, metrics, and traces) from the sample API application. The ADOT collector configuration YAML file typically includes a receivers, processors, exporters and service sections. Here’s an example of ADOT collector configuration YAML file that sends logs to Amazon CloudWatch Logs using AWS CloudWatch Logs Exporter. In this example, the ADOT collector is configured to receive logs using the OTLP protocol over gRPC and HTTP and then export the logs to the specified Amazon CloudWatch Logs log group and log stream in the us-east-1 region.
extensions:
  health_check:

receivers:
  otlp:
    protocols:
      grpc:
        endpoint: 0.0.0.0:4317
      http:
        endpoint: 0.0.0.0:4318

processors:
  batch:
    send_batch_max_size: 10000
    timeout: 1s

exporters:
  awscloudwatchlogs:
    # Change the below parameters if required.
    log_group_name: "sampleapi-logs"
    log_stream_name: "sampleapi-logstream"
    region: "us-east-1"

service:
  pipelines:
    logs:
      receivers: [otlp]
      processors: [batch]
      exporters: [awscloudwatchlogs]

  extensions: [health_check]
2) Create an SSM Parameter Store to securely store and manage the configuration file for the ADOT collector. For more information, see documentation how to create and store ADOT configuration file in SSM parameter store. For your reference, a screenshot of the SSM parameter store follows:
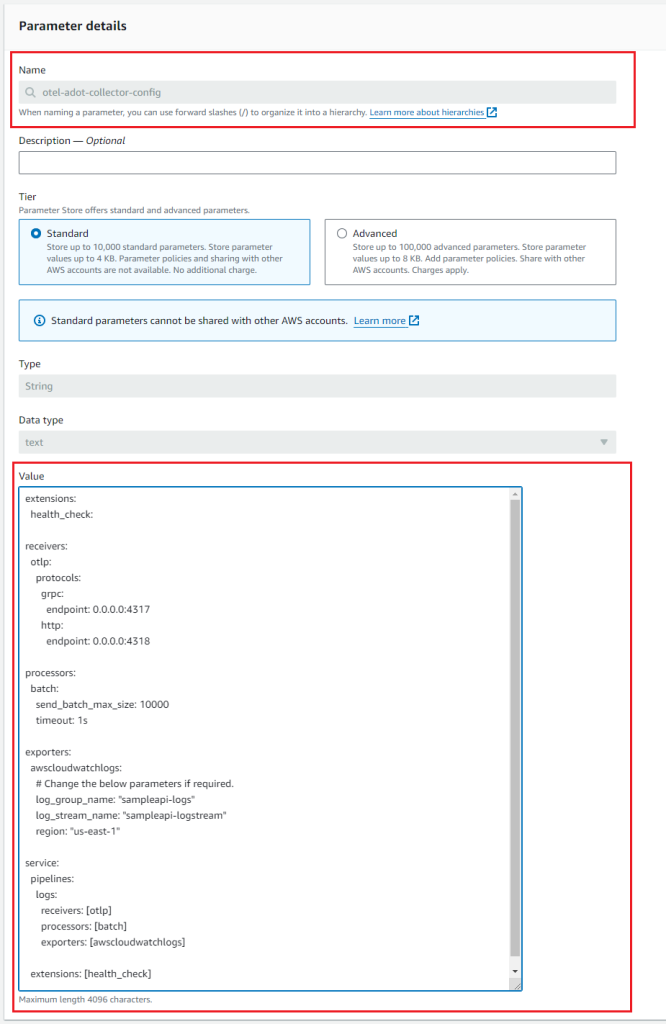
Figure 1: SSM Parameter Store for ADOT collector
Creating ECS task definition
Create an ECS task definition with two container images. See documentation how to create a task definition by using AWS console
1) Add a container for ADOT collector using public ECR image of ADOT collector - public.ecr.aws/aws-observability/aws-otel-collector:latest. In the container environment variables section, add an environment variable AOT_CONFIG_CONTENT that references the ADOT collector configuration from SSM parameter store using SSM ARN. The field Value type should be set to ValueFrom when referencing SSM ARN. Also, configure the health check endpoint for ADOT collector.
Figure 2 and Figure 3 are the screenshot references for ADOT collector container configuration.
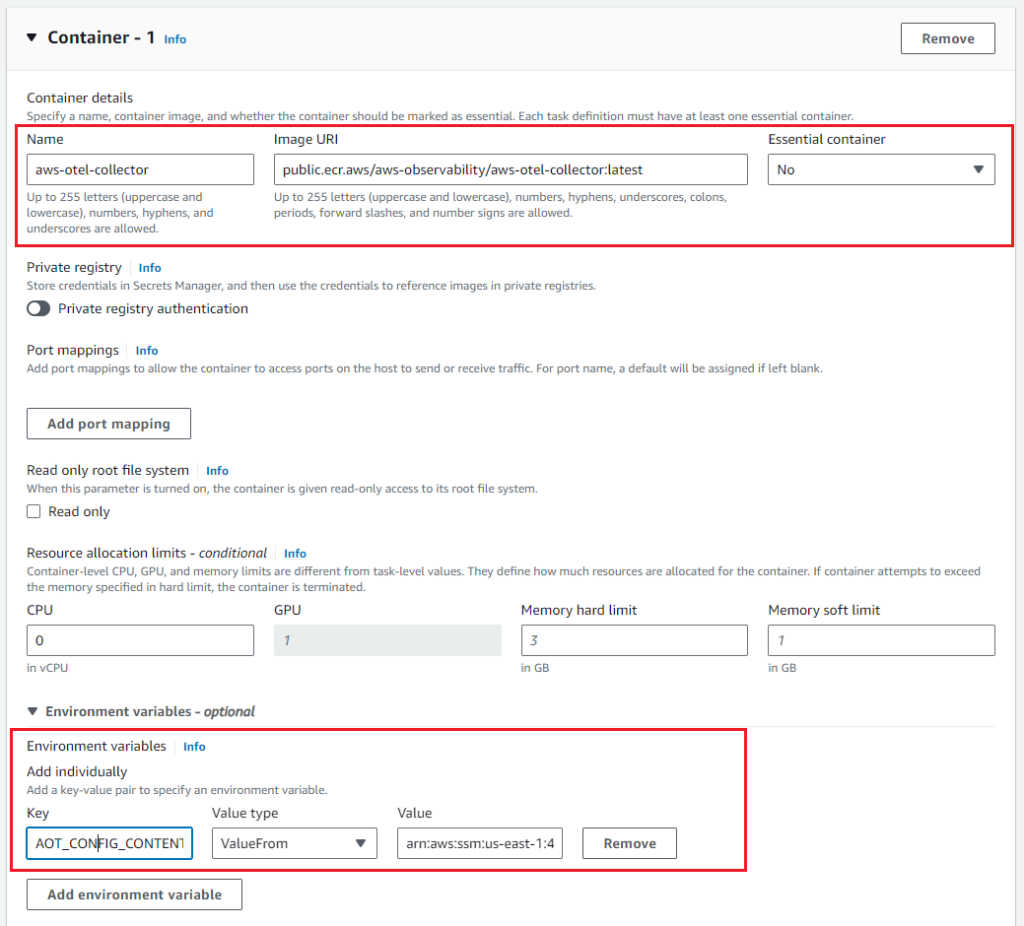
Figure 2: ADOT collector container configuration
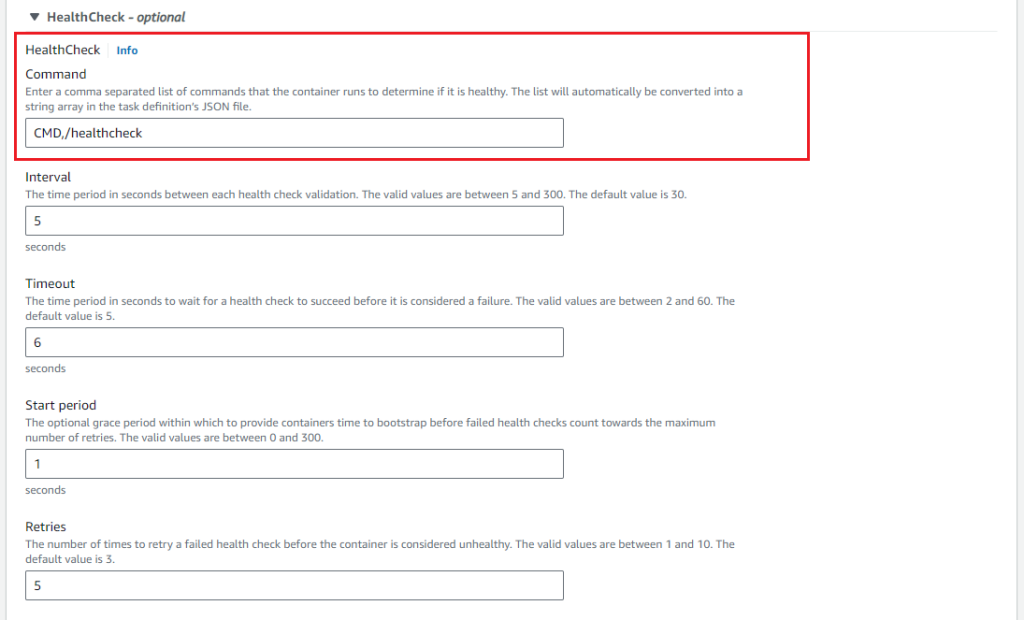
Figure 3: ADOT collector container configuration (continued)
2) Add a container for the sample API using ECR image from previous step. In the container environment variables section, add an environment variable OTEL_EXPORTER_OTLP_ENDPOINT to provide the receiver URL of the ADOT collector. Also, add a health check endpoint and startup dependency to ensure the ADOT collector container is in healthy state before sample API container starts.
Note: OTEL_EXPORTER_OTLP_ENDPOINT environment variable is not needed if you are using default ports (4137, 4138) in ADOT collector configuration.
Figure 4 and Figure 5 are the screenshot references for the sample API container configuration.
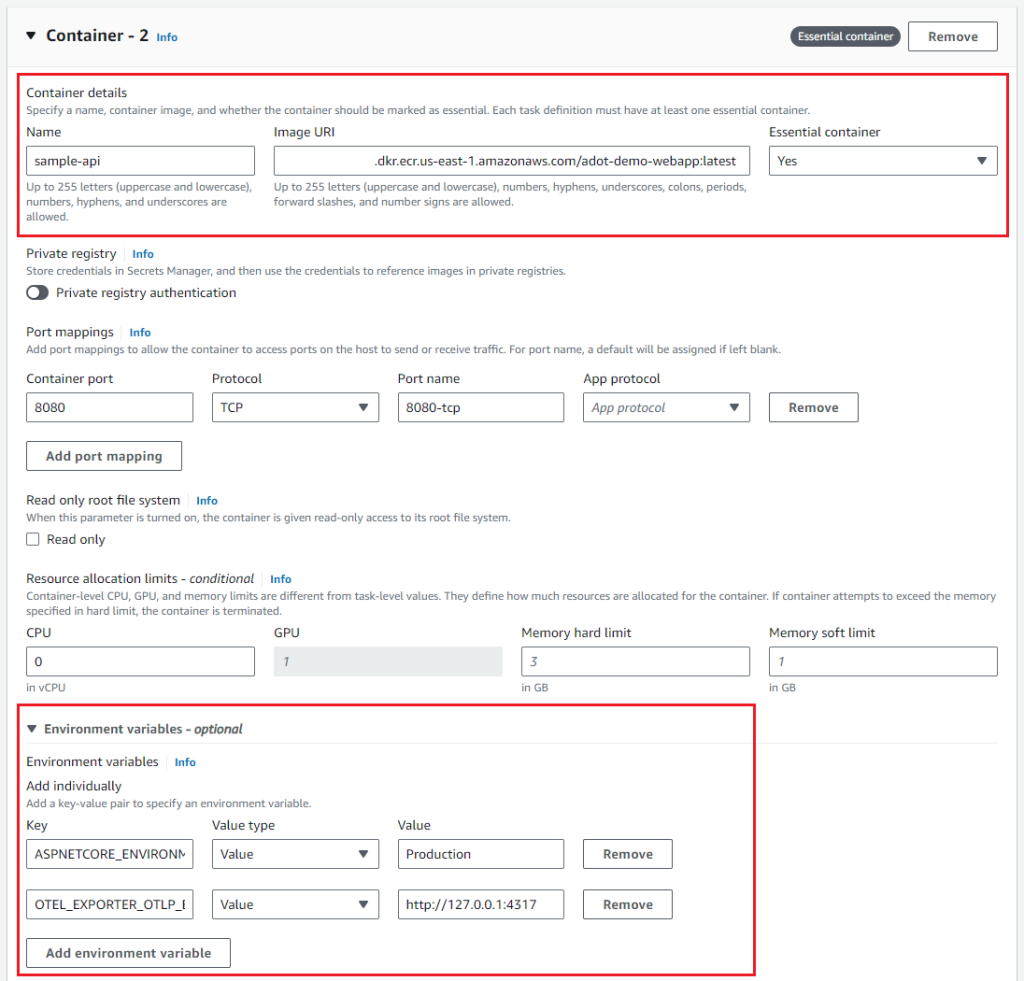
Figure 4: Sample API container configuration
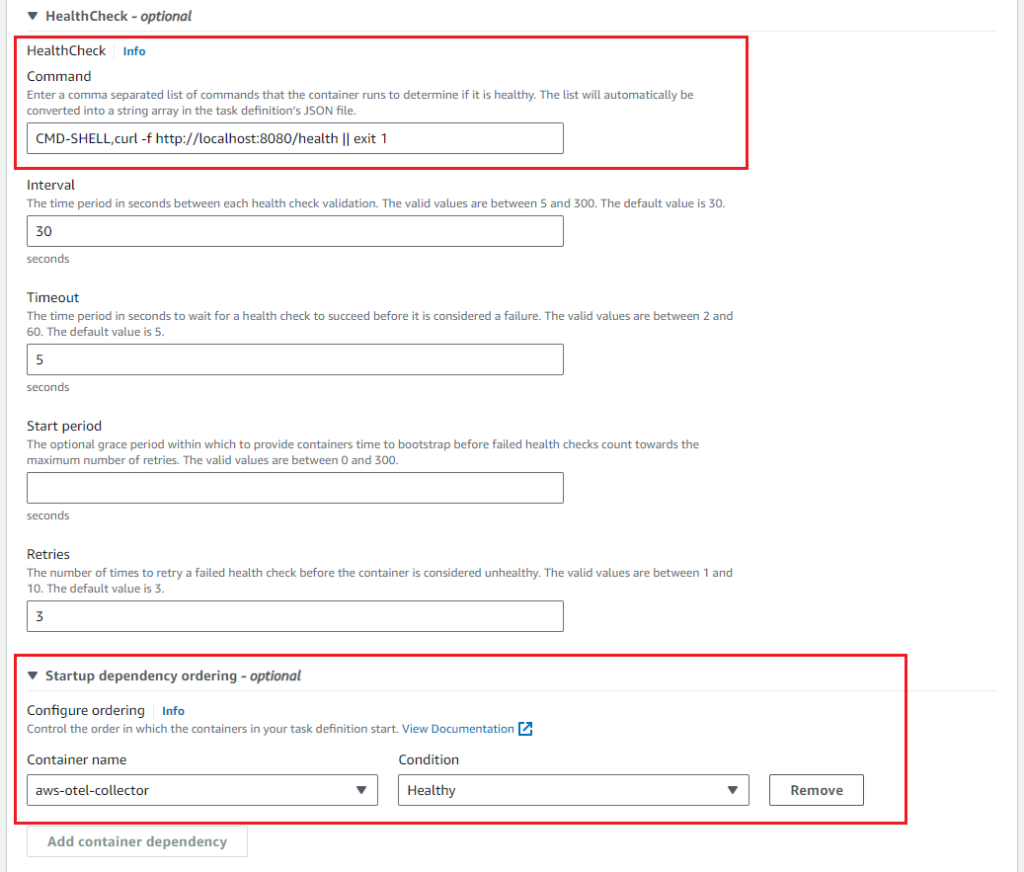
Figure 5: Sample API container configuration (continued)
3) Add necessary IAM permissions to ECS task execution role. To retrieve configuration values from the AWS Systems Manager (SSM) Parameter store, the ADOT Collector container needs permission to access the ssm:GetParameters action. Ensure that the task execution IAM role has the necessary permissions to allow the container to read necessary configuration values from the Parameter store. Here is a sample IAM policy statement that allows read permission to parameter store:
{
    "Version": "2012-10-17",
    "Statement": [
        {
            "Effect": "Allow",
            "Action": [
                "ssm:GetParameters"
            ],
            "Resource": [
				"arn:aws:ssm:{Region}:{Account}:parameter/{ssm-parameter-name}"
			]
        }
    ]
}
4) Add necessary IAM permissions to ECS task role. To allow the ADOT collector to publish application logs to Amazon CloudWatch Logs, you need to create an IAM policy and assign it to the task IAM role. Here is a sample IAM policy statement that allows read and write access to CloudWatch log groups and log streams:
{
    "Version": "2012-10-17",
    "Statement": [
        {
            "Effect": "Allow",
            "Action": [
                "logs:PutLogEvents",
                "logs:CreateLogGroup",
                "logs:CreateLogStream",
                "logs:DescribeLogStreams",
                "logs:DescribeLogGroups",
                "logs:PutRetentionPolicy"
            ],
            "Resource": [
				"arn:aws:logs:{Region}:{Account}:log-group:{LogGroupName}"
			]
        }
    ]
}
Remember to replace the placeholders with the appropriate AWS Region and Account ID to restrict the policy to a specific region and account.
5) Finish creating the task definition. Once it's created, we move to the next step of creating ECS cluster, service and configuring load balancer.
Setting up an ECS cluster
To set up an Amazon ECS cluster using the Amazon ECS console, please see documentation Creating an Amazon ECS cluster.
Configuring an ECS service
To create an Amazon ECS service using the Amazon ECS console, please see documentation Creating an Amazon ECS service.
Configuring load balancer with target groups.
To configure an Application Load Balancer using the Amazon EC2 console, please see documentation Create an Application Load Balancer.
Step 6: Testing the application on ECS Fargate
1) After the deployment steps are completed successfully, we have the ECS task with two running containers: sample API container and the ADOT collector container as shown in Figure 6:

Figure 6: Running containers
2) Test the application by calling the APIs such as https://<ALB-URL>/weatherforecast.
3) Go to the CloudWatch console and the log group that was specified in the ADOT collector yaml configuration to see the application logs present in the log stream. The logs are structured and contain custom properties that were added via opentelemetry processors.
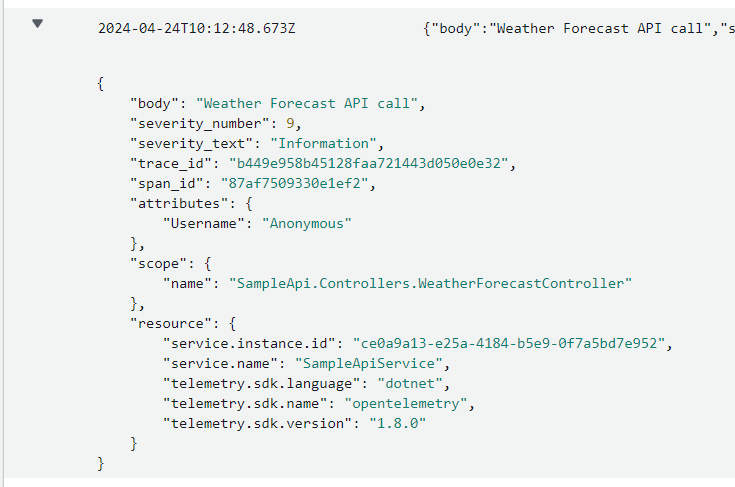
Figure 7: Logs
Cleanup
To save costs, delete the resources you created as part of this blog post:
- Delete Application Load Balancer (ALB)
- Delete ECS Service
- Delete ECS Cluster
- Delete ECS Task Definition
- Delete ECR Repository
Conclusion
Open Telemetry in .NET offers a powerful and flexible framework for generating and managing telemetry data. By creating custom processors, developers extend the capabilities of Open Telemetry to meet the specific requirements of their applications.
The ability to enrich, transform, filter, or redact telemetry data ensures that the collected information aligns with business needs and complies with relevant regulations or policies.
Now that you have the example from this blog post, you can develop your own custom processors and fully utilize Open Telemetry in your .NET applications.