AWS News Blog
AWS X-Ray – See Inside of Your Distributed Application
From what I can tell, Presidential Medal of Freedom recipient Grace Hopper was the first person to apply the term debugging to the process of identifying and removing errors from programs.
While I have never had to extract an actual bug from a computer, I did spend plenty of time debugging assembly language programs early in my career. Back then, debugging consisted of single-stepping through code, examining the contents of each processor register before and after each step in order to verify that your mental model was in accord with what was actually happening. It was fairly tedious, but it left little room for bugs to hide and rewarded you with an in-depth understanding of how your code worked. Later, single-stepping gave way to debug output (hello, stderr) and from there to log files and log analysis tools.
Over the last decade or two, as complex distributed systems have emerged, debugging has changed and has taken on a new meaning. With unit tests ensuring that individual functions and modules behave as expected, the challenge turns to looking at patterns of behavior at scale. The combination of cloud computing, microservices, and asynchronous, notification-based architectures has brought forth systems that have hundreds or thousands of moving parts. The challenge of identifying and addressing performance issues in these complex systems has only grown, as has the difficulty of aggregating individual, service-level observations into meaningful top-level results. There has been no easy way for developers to “follow-the-thread” as execution traverses EC2 instances, ECS containers, microservices, AWS database and messaging services.
Let’s fix this!
Introducing AWS X-Ray
Today I would like to tell you about AWS X-Ray. We have made it possible for you to trace requests from beginning to end across all of the touch-points that I just mentioned. It addresses the problems that come about when you want to understand and improve distributed systems at scale, and gives you the information and the insights that you need to have in order to do this.
X-Ray captures trace data from code running on EC2 instances (including ECS containers), AWS Elastic Beanstalk, Amazon API Gateway, and more. It implements follow-the-thread tracing by adding an HTTP header (including a unique ID) to requests that do not already have one, and passing the header along to additional tiers of request handlers. The data collected at each point is called a segment, and is stored as a chunk of JSON data. A segment represents a unit of work, and includes request and response timing, along with optional sub-segments that represent smaller work units (down to lines of code, if you supply the proper instrumentation). A statistically meaningful sample of the segments are routed to X-Ray (a daemon process handles this on EC2 instances and inside of containers) where it is assembled into traces (groups of segments that share a common ID). The traces are segments are further processed to create service graphs that visually depict the relationship of services to each other.
I spent a few minutes walking through the X-Ray console in order to see how all of this fits together. Along the way I made use of some sample apps that the console offered up for launch on my behalf:

Each sample app is launched by a AWS CloudFormation template. The apps make use of the newest AWS AWS SDKs; these SDKs are X-Ray aware and participate in the process of collecting and storing X-Ray segments. The Java, Node.js, and .NET SDKs now include support for X-Ray; we’ll be updating the others as soon as possible. AWS Lambda support is coming soon.
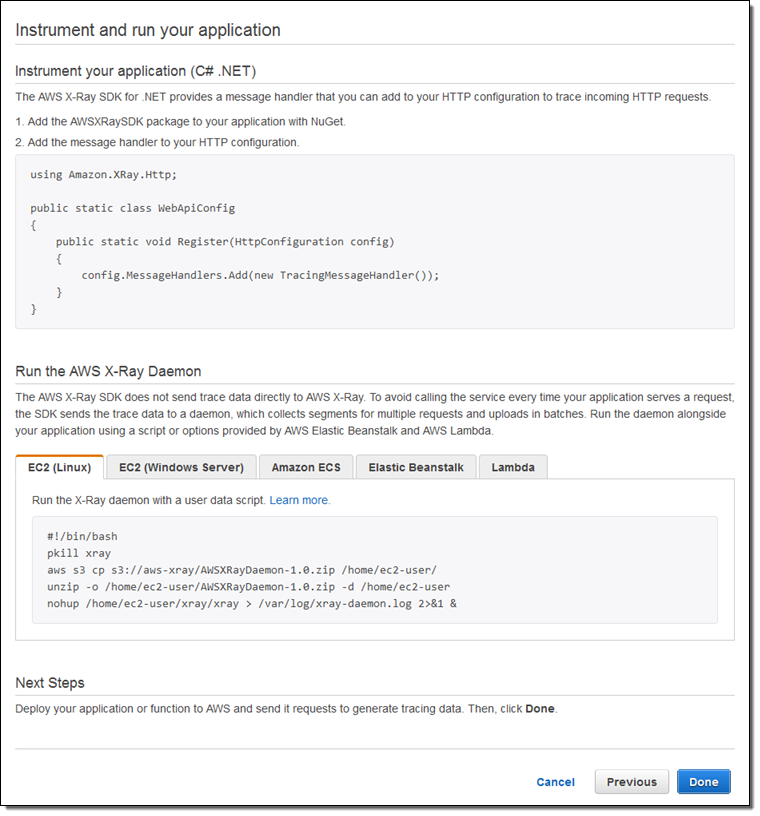
When you are ready to instrument and run your own applications, the X-Ray Console will show you what you have to do:
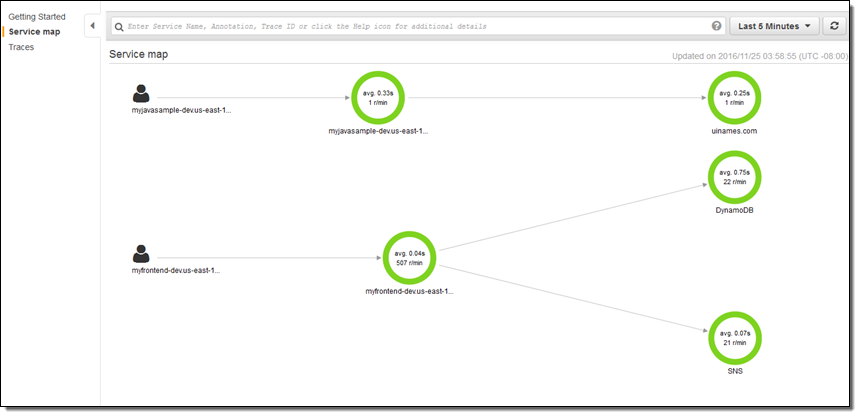
I launched a pair of apps, ran them for a bit, and then hopped over to the X-Ray Console to see what was happening. The Service Map gives me a top-level view:
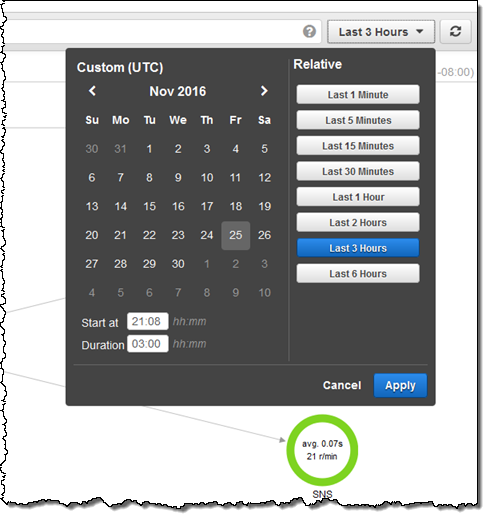
I can use the date/time range selector to indicate the time frame of interest:
I can click on any node in the graph in order to take a look at the traces behind it:
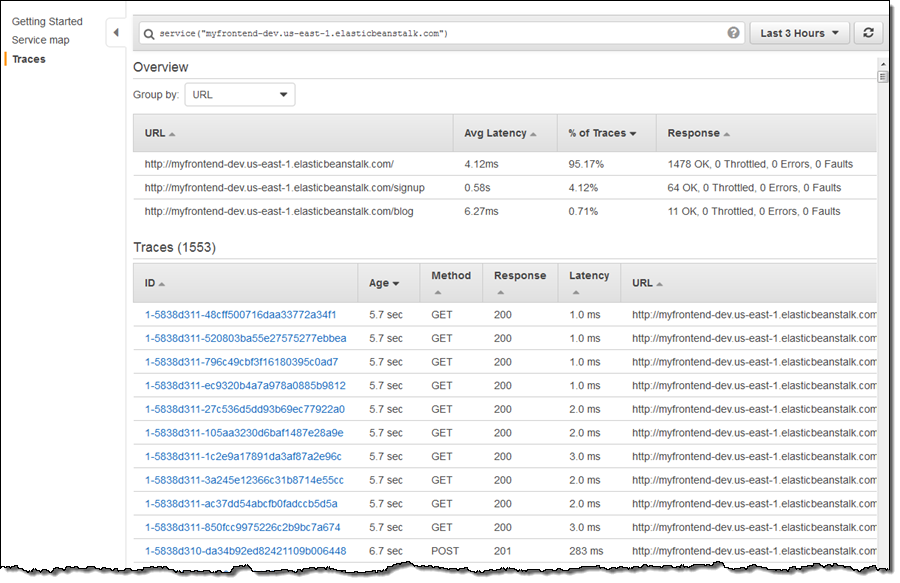
At the top of the page I can see that the signup operation, while infrequent (4.12% of the traces) has higher latency than the other two operations.First I sort by URL to group the signup operations together, and then I look at the segments that contribute to the particular trace. Here’s one that includes calls to DynamoDB and SNS:

This shows me that, when invoked from the entry point of interest, the call to DynamoDB is taking a long time. Calls to DynamoDB run in single-digit milliseconds so I should take a closer look. I focus on the Meta column, click on the document icon, and then examine the Resources tab to see what’s going on:
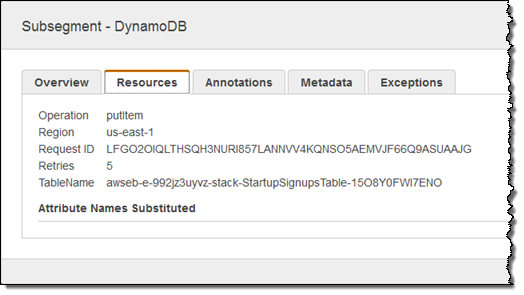
Looks like the client SDK is doing some retries, mostly likely because the table should be provisioned for additional read or write throughput.
The X-Ray UI is built around the concept of filter expressions. There are dedicated UI elements for a few key features, but the rest (as befits a developer-oriented tool) is powered by free-form filters that you simply enter in the text box at the top of the page. Here are a few very simple examples:
responsetime > 5– Response time more than 5 seconds.duration >= 5 AND duration <= 8– Duration between 5 and 8 seconds.service("dynamodb")– Requests that include a call to DynamoDB.
You can also filter by dates, trace IDs, HTTP methods & status codes, URLs, user agents, client IP addresses, and much more.
Everything that I have shown you (and a whole lot more) is also accessible from the X-Ray APIs and the AWS Command Line Interface (AWS CLI). This should open the door to all sorts of high-level tools, visualizations, and partner opportunities. Leave me a comment and let me know what you build!
Available Now
AWS X-Ray is available in preview form now in all 12 public AWS Regions and you can start using it today!
If you’d like to learn more, we have a webinar on January 16th. You can register for it here.
— Jeff;