AWS Security Blog
Create security observability using generative AI with Security Lake and Amazon Q in QuickSight
Generative artificial intelligence (AI) is now a household topic and popular across various public applications. Users enter prompts to get answers to questions, write code, create images, improve their writing, and synthesize information. As people become familiar with generative AI, businesses are looking for ways to apply these concepts to their enterprise use cases in a simple, scalable, and cost-effective way. These same needs are shared by a variety of security stakeholders. For example, if security directors want to summarize their security posture in natural language, a security architect will need to triage alerts or findings and investigate AWS CloudTrail logs to identify high priority remediation actions or detect potential threat actors by identifying potentially malicious activity. There are many ways to deploy solutions for these use cases.
In this blog post, we review a fully serverless solution for querying data stored in Amazon Security Lake using natural language (human language) with Amazon Q in QuickSight. This solution has multiple use cases, such as generating visualizations and querying vulnerability information for vulnerability management using tools such as Amazon Inspector that feed into AWS Security Hub. The solution helps reduce the time from detection to investigation by using natural language to query CloudTrail logs and Amazon Virtual Private Cloud (VPC) Flow Logs, resulting in quicker response to threats in your environment.
Amazon Security Lake is a fully managed security data lake service that automatically centralizes security data from AWS environments, software as a service (SaaS) providers, and on-premises and cloud sources into a purpose-built data lake that’s stored in your AWS account. The data lake is backed by Amazon Simple Storage Service (Amazon S3) buckets, and you retain ownership over your data. Security Lake converts ingested data into Apache Parquet format and a standard open source schema called the Open Cybersecurity Schema Framework (OCSF). With OCSF support, Security Lake normalizes and combines security data from AWS and a broad range of enterprise security data sources.
Amazon QuickSight is a cloud-scale business intelligence (BI) service that delivers insights to stakeholders, wherever they are. QuickSight connects to your data in the cloud and combines data from a variety of different sources. With QuickSight, users can meet varying analytic needs from the same source of truth through interactive dashboards, reports, natural language queries, and embedded analytics. With Amazon Q in QuickSight, business analysts and users can use natural language to build, discover, and share meaningful insights.
The recent announcements for Amazon Q in QuickSight, Security Lake, and the OCSF present a unique opportunity to apply generative AI to fully managed hybrid multi-cloud security related logs and findings from over 100 independent software vendors and partners.
Solution overview
The solution uses Security Lake as the data lake which has native ingestion for CloudTrail, VPC Flow Logs, and Security Hub findings as shown in Figure 1. Logs from these sources are sent to S3 buckets in your AWS account and are maintained by Security Lake. We then create Amazon Athena views from tables created by Security Lake for Security Hub findings, CloudTrail logs, and VPC Flow Logs to define the interesting fields from each of the log sources. Each of these views are ingested into a QuickSight dataset. From these datasets, we generate analyses and dashboards. We use Amazon Q topics to label columns in the dataset that are human-readable and create a named entity to present contextual and multi-visual answers in response to questions. After the topics are created, users can perform their analysis using Q topics, QuickSight analyses, or QuickSight dashboards.
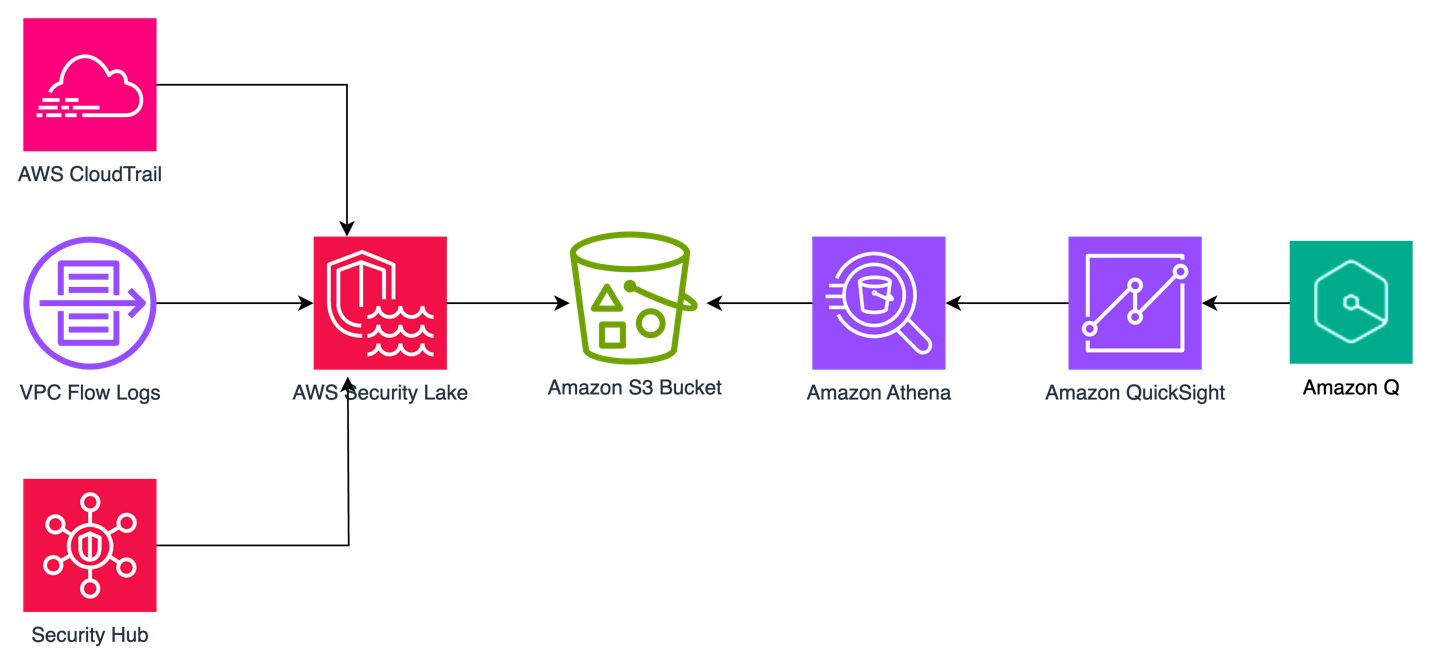
Figure 1: Solution architecture
You can use the rollup AWS Region feature in Security Lake to aggregate logs from multiple Regions into a single Region. Specifying a rollup Region can help you adhere to regional compliance requirements. If you use rollup Regions, you must set up the solution described in this post for datasets only in rollup Regions. If you don’t use a rollup Region, you must deploy this solution for each Region you that want to collect data from.
Prerequisites
To implement the solution described in this post, you must meet the following requirements:
- Basic understanding of Security Lake, Athena, and QuickSight.
- Security Lake is already deployed and accepting CloudTrail management events, VPC Flow Logs, and Security Hub findings as sources. If you haven’t deployed Security Lake yet, we recommend following the best practices established in the security reference architecture.
- This solution uses Security Lake data source version 2 to create the dashboards and visualizations. If you aren’t already using data source version 2, you will see a banner in your Security Lake console with instructions to update.
- An existing QuickSight deployment that will be used to visualize Security Lake data or an account that is able to sign up for QuickSight to create visualizations.
- QuickSight Author Pro and Reader Pro licenses are needed for using Amazon Q features in QuickSight. Non-pro Authors and Readers can still access Q topics if an Author Pro or Admin Pro user shares the topic with them. Non-pro Authors and Readers can also access data stories if a Reader Pro, Author Pro, or Admin Pro shares one with them. Review Generative AI features supported by each QuickSight licensing tiers.
- AWS Identity and Access Manager (IAM) permissions for QuickSight, Athena, Lake Formation, Security Lake, and AWS Resource Access Manager.
In the following section, we walk through the steps to ingest Security Lake data into QuickSight using Athena views and then using Amazon Q in QuickSight to create visualizations and query data using natural language.
Provide cross-account query access
In alignment with our security reference architecture, it’s a best practice to isolate the Security Lake account from the accounts that are running the visualization and querying workloads. It’s recommended that QuickSight for security use cases be deployed in the security tooling account. See How to visualize Amazon Security Lake findings with Amazon QuickSight for information on how to set up cross-account query access. Follow the steps in the Configure a Security Lake subscriber section and configure Athena to visualize your data section.
When you get to the create resource link steps, create a resource link for data source version 2 for Security Hub, CloudTrail, and VPC flow log tables for a total of three resource links. The way to identify data source version 2 tables is by their name; it ends in _2_0. For example:
amazon_security_lake_table_us_east_1_sh_findings_2_0amazon_security_lake_table_us_east_1_cloud_trail_mgmt_2_0amazon_security_lake_table_us_east_1_vpc_flow_2_0
For the remainder of this post, we will be referencing the database name security_lake_visualization and the resource link names for Security Hub findings, CloudTrail logs, and VPC Flow Logs respectively, as shown in Figure 2:
securitylake_shared_resourcelink_securityhub_2_0_us_east_1securitylake_shared_resourcelink_cloudtrail_2_0_us_east_1securitylake_shared_resourcelink_vpcflow_2_0_us_east_1
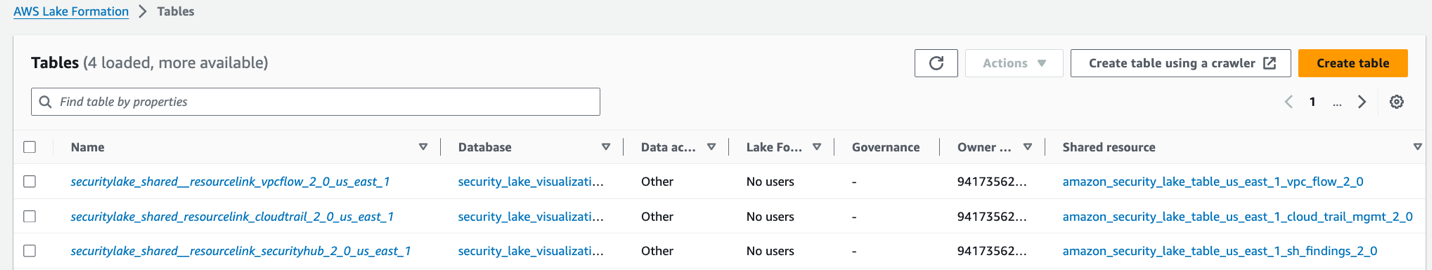
Figure 2: Lake Formation table snapshot
We will call the QuickSight account the visualization account. If you plan to use same account as the Security Lake delegated administrator and QuickSight, then skip this step and go to the next section where you will create views in Athena.
Create views in Athena
A view in Athena is a logical table that helps simplify your queries by working with only a subset of the relevant data. Follow these steps to create three views in Athena, one each for Security Hub findings, CloudTrail logs, and the VPC Flow Logs in the visualization account.
These queries default to the previous week’s data starting from the previous day, but you can change the time frame by modifying the last line in the query from 8 to the number of days you prefer. Keep in mind that there is a limitation on the size of each SPICE table of 1 TB. If you want to limit the volume of data, you can delete the rows that you find unnecessary. We included the fields customers have identified as relevant to reduce the burden of writing the parsing details yourself.
To create views:
- Sign in to the AWS Management Console in the visualization account and navigate to the Athena console.
- If a Security Lake rollup Region is used, select the rollup Region.
- Choose Launch Query Editor.
- If this is the first time you’re using Athena, you will need to choose a bucket to store your query results.
- Choose Edit Settings.
- Choose Browse S3.
- Search for your bucket name.
- Select the radio button next to the name of your bucket.
- Select Choose.
- For Data Source, select AWSDataCatalog.
- Select Database as security_lake_visualization. If you used a different name for the database for cross account query access, then select that database.

Figure 3: Athena database selection
- Copy the query for the
security_hub_viewfrom the GitHub repo for this post. If you’re using a different name for the database and table resource link than the one specified in this post, edit the FROM statement at the bottom of the query to reflect the correct names. - Paste the query in the query editor and then choose Run. The name of the view is set in the first line of the query which is
security_insights_security_hub_vw2. - To confirm this view was created correctly, choose the three dots next to the view that was created and select Preview View.

Figure 4: Previewing the view
- Repeat steps 5–9 to create the CloudTrail and VPC Flow Logs views. The queries for each can be found in the GitHub repo.

Figure 5: Athena views
Create QuickSight dataset
Now that you’ve created the views, use Athena as the data source to create a dataset in QuickSight. Repeat these steps for the Security Hub findings, CloudTrail logs, and VPC Flow Logs. Start by creating a dataset for the Security Hub findings.
To configure permissions on tables:
- Sign in to the QuickSight console in the visualization account. If a Security Lake rollup Region is used, select the rollup Region.
- If this is the first time you’re using QuickSight, you must sign up for a QuickSight subscription.
- Although there are multiple ways to sign in to QuickSight, we used IAM based access to build the dashboards. To use QuickSight with Athena and Lake Formation, you first need to authorize connections through Lake Formation.
- When using a cross-account configuration with AWS Glue Data Catalog, you need to configure permissions on tables that are shared through Lake Formation. For the use case in this post, use the following steps to grant access on the cross-account tables in the Glue Catalog. You must perform these steps for each of the Security Hub, CloudTrail, and VPC Flow Logs tables that you created in the preceding cross-account query access section. Because granting permissions on a resource link doesn’t grant permissions on the target (linked) database or table, you will grant permission twice, once to the target (linked table) and then to the resource link.
- In the Lake Formation console, navigate to the Tables section and select the resource link for the Security Hub table. For example:
securitylake_shared_resourcelink_securityhub_2_0_us_east_1 - Select Actions. Under Permissions, select Grant on target.
- For the next step, you need the Amazon Resource Name (ARN) of the QuickSight users or groups that need access to the table. To obtain the ARN through the AWS Command Line Interface (AWS CLI), run following commands (replacing account ID and Region with that of the visualization account.) You can use AWS CloudShell for this purpose.
- For users
aws quicksight list-users --aws-account-id 111122223333 --namespace default --region us-east-1 - For groups
aws quicksight list-groups --aws-account-id 111122223333 --namespace default --region us-east-1
- For users
- After you have the ARN of the user or group, copy it and go back to the LakeFormation console Grant on Target page. For Principals, select SAML users and groups, and then add the QuickSight user’s ARN.

Figure 6: Selecting principals
- For LF-Tags or catalog resources, keep the default settings.

Figure 7: Table grant on target permissions
- For Table permissions, select Select for both Table Permissions and Grantable Permissions, and then choose Grant.

Figure 8: Selecting table permissions
- Navigate back to the Tables section and select the resource link for the Security Hub table. For example:
securitylake_shared_resourcelink_securityhub_2_0_us_east_1 - Select Actions. This time under Permissions, and then choose Grant.
- For Principals, select SAML users and groups, and then add the QuickSight user’s ARN captured earlier.
- For the LF-Tags or catalog resources section, use the default settings.
- For Resource link permissions choose Describe for both Table Permissions and Grantable Permissions.
- Repeat steps a–k for the CloudTrail and VPC Flow Logs resource links.
- In the Lake Formation console, navigate to the Tables section and select the resource link for the Security Hub table. For example:
To create datasets from views:
- After permissions are in place, you create three datasets from the views created earlier. Because both Quicksight and Lake Formation are Regional services, verify that you’re using QuickSight in the same Region where Lake Formation is sharing the data. The simplest way to determine your Region is to check the QuickSight URL in your web browser. The Region will be at the beginning of the URL, such as us-east-1. To change the Region, select the settings icon in the top right of the QuickSight screen and select the correct Region from the list of available Regions in the drop-down menu.
- Navigate back to the QuickSight console.
- Select Datasets, and then choose New dataset.
- Select Athena from the list of available data sources.
- Enter a Data source name, for example
security_lake_securityhub_datasetand leave the Athena workgroup as[primary]. Choose Create data source. - At the Choose your table prompt, for Catalog, select AwsDataCatalog. For Database, select
security_lake_visualization. If you used a different name for the database for cross-account query access, then select that database. For Tables, select the view namesecurity_insights_security_hub_vw2to build your dashboards for Security Hub findings. Then choose Select.
Figure 9: Choose a table during QuickSight dataset creation
- At the Finish dataset creation prompt, select Import to SPICE for quicker analytics. Choose Visualize. This will create a new dataset in QuickSight using the name of the Athena view, which is
security_insights_security_hub_vw2. You will be taken to the Analysis page, exit out of it. - Go back to the QuickSight console and repeat steps 3–8 for the CloudTrail and VPC Flow Log datasets.
Create a topic
Now that you have created a dataset, you can create a topic. Q topics are collections of one or more datasets that represent a subject area for your business users to ask questions. Topics allow users to ask questions in natural language and to build visualizations using natural language.
To create a Q topic:
- Navigate to the QuickSight console.
- Choose Topics in the left navigation pane.

Figure 10: QuickSight navigation pane
- Choose New topic. Create one topic each for the Security Hub findings, CloudTrail logs, and VPC Flow Logs

Figure 11: QuickSight topic creation
- On the New topic page, do the following:
- For Topic name, enter a descriptive name for the topic. Name the first one
SecurityHubTopic. Your business users will identify the topic by this name and use it to ask questions. - For Description, enter a description for the topic. Your users can use this description to get more details about the topic.
- Choose Continue.
- For Topic name, enter a descriptive name for the topic. Name the first one
- On the Add data to topic page, choose the dataset you created in the Create a QuickSight dataset section. Start with the Security Hub dataset
security_insights_security_hub_vw2. - Choose Continue. It will take a few minutes to create the topic.
- Now that your topic has been created, navigate to the Data tab of the topic.
- Your Data Fields sub-tab should be selected already. If not, choose Data Fields.

Figure 12: Topics data fields
- For each of the fields in the list, turn on Include to make sure that all fields are included. For this example, we selected all fields, but you can adjust the included columns as needed for your use case. Note, you might see a banner at the top of the page indicating that the indexing is in progress. Depending on the size of your data, it might take some time for Q to make those fields available for querying. Most of the time, indexing is complete in less than 15 minutes.
- Review the Synonyms column. These alternate representations of your column name are automatically generated by Amazon Q. You can add and remove synonyms as needed for your use case.
- At this point, you’re ready to ask questions about your data using Amazon Q in QuickSight. Choose Ask a question about SecurityHubTopic at the top of the page.

Figure 13: Ask questions using Q
- You can now ask questions about Security Hub findings in the prompt. Enter
Show me findings with compliance status failed along with control id.
Figure 14: Q answers
- Under the question, you will see how it was interpreted by QuickSight.
- Repeat steps 1–13 to create CloudTrail and VPC Flow Log QuickSight topics.
Create named entities for your topics
Now that you’ve created your topics, you will now add named entities. Named entities are optional, but we’re using them in the solution to help make queries more effective. The information contained in named entities, the ordering of fields, and their ranking make it possible to present contextual, multi-visual answers in response to even vague questions.
To create a named entity:
- In the QuickSight console, navigate to Topics.
- Select the Security Hub topic that you created in the previous section.
- Under the Data tab, select the Named Entity subtab, and choose Add Named Entity.

Figure 15: Named entity subtab
- Enter
Security Findingsas the entity name. - Select the following datafields: Status, Metadata Product Name, Finding Info Title, Region, Severity, Cloud Account Uid, Time Dt, Compliance Status, and AccountId. The order of the fields helps Q to prioritize the data, so rearrange your data fields as needed.

Figure 16: Security hub finding names entity creation
- Choose Save in the top right corner to save your results.
- Repeat steps 1–6 with the CloudTrail dataset using the following datafields: API operation, Time Dt, Region, Status, AccountId, API Response Error, Actor User Credential Uid, Actor User Name, Actor User Type, Api Service Name, Actor Idp Name, Cloud Provider, Session Issuer, and Unmapped.

Figure 17: CloudTrail named entity creation
- Repeat steps 1–6 with the VPC Flow Log dataset using the following datafields: Src Endpoint IP, Src Endpoint Port, Dst Endpoint IP, Dst Endpoint Port, Connection Info Direction, Traffic Bytes, Action, Accountid, Time Dt, and Region.

Figure 18: VPC Flow log named entity creation
Create visualizations using natural language
After your topic is done indexing, you can start creating visualizations using natural language. In QuickSight, an analysis is the same thing as a dashboard, but is only accessible by the authors. You can keep it private and make it as robust and detailed as you want. When you decide to publish it, the shared version is called a dashboard.
To create visualizations:
- Open the QuickSight console and navigate to the Analysis tab.
- In the top right, select New analysis.
- Select the dataset you created previously, it will have the same naming convention as the Athena view. For reference, the Athena view query created a Security Hub dataset called
security_insights_security_hub_vw2. - Validate the information about the data set you’re going to use in the analysis and choose USE IN ANALYSIS.
- On the pop up, select the interactive sheet option and choose Create.
- For datasets that have a corresponding Q topic, which you created in a previous step, choose Build visual at the top of the screen.

Figure 19: Build visual using natural language
- Enter your prompt and choose BUILD. For example, enter
findings with product security hub group by control id include count. Q automatically generates a visualization.
Figure 20: Q response
- To add to your dashboard, choose ADD TO ANALYSIS to see your new visualization module in your current analysis.
- The supplied questions are targeted towards a Security Hub findings topic, where you can ask questions about your security hub findings data. For example,
show all Security Hub findings for critical severity for a specific resource or ARN. - If you use Amazon Inspector for software vulnerability management and you want to monitor top common vulnerabilities and exposures (CVEs) affecting your organization, choose Build visual and enter
show all ACTIVE findings with product inspector group by Title add countin the prompt. We used the keyword ACTIVE because ACTIVE is a finding state in Security Hub that indicates the finding is still active as per the finding source and Amazon Inspector has not closed the finding yet. If Amazon Inspector has closed the finding, the finding will have a state of ARCHIVED.
Figure 21: Q Response for an Amazon Inspector findings question
- After you add visualization to the analysis, you can customize it further using various QuickSight visualization options.
- To add the remaining datasets, which allows you to visualize data from multiple datasets in a single view, select the dropdown in the left navigation under Dataset.
- Select Add a new dataset.
- Search the name of the remaining datasets you created previously.
- Select anywhere on the name of the dataset to make the radial button blue for the single dataset you want to add. Choose Select.
- Repeat steps 7–12 in this section to add all the corresponding datasets you created previously.
Note: When you add additional datasets to the same Analysis and use Build visual to generate visualizations using natural language, the corresponding datasets with Q Topics are populated in the drop down under the prompt. Be sure to choose the correct dataset when asking questions.
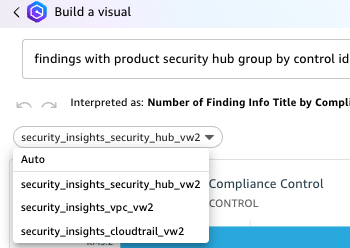
Figure 22: Choosing a QuickSight dataset
To create dashboards:
- After you’ve created the visual and are ready to publish the analysis as a dashboard, select PUBLISH in the top right corner.
- Enter a name for your dashboard.
- Choose Publish Dashboard.
- After your dashboard is published, your users can ask questions about the data through the dashboard as well. This dashboard can be shared with other users. Users with QuickSight Reader Pro licenses can ask questions using Amazon Q.
To ask questions using the dashboard:
- Navigate to the Dashboards section on the left navigation.
- Select the dashboard you previously published.
- Select Ask a question about [Topic Name] at the top of the screen. A module will open from the side of your screen. Questions can only be addressed to a single topic. To change the topic, select the name of the topic and a drop-down will appear. Select the name of the current topic to see other options and select the topic you want to ask a question about. For this example, select CloudTrailTopic.

Figure 23: Selecting a topic
- Enter a question in the prompt. For this example, enter
show top API operations in the last 24 hours with accessdenied.
Figure 24: CloudTrail question 1
- Enter
show all activity by user johndoe in the last 3 days.
Figure 25: CloudTrail question 2
- Q will automatically build a small dashboard based on the questions provided.
- Now change the topic to VPCFlowTopic as described in step 3.
- Enter
show me the top 5 dst ip by bytes for outbound traffic with dst port 443.
Figure 26: VPC Flow Log question
You can build executive summaries using QuickSight data stories, which also use generative AI. Data stories use Amazon Q prompts and visuals to produce a draft that incorporates the details that you provide. For example, you can create a data story about how a specific CVE affects your organization by asking Q questions, then add visuals from analyses you already created.
Conclusion
In this blog post, you learned how to use generative AI for your security use cases. We showed you how to use cross-account query access to allow a QuickSight visualization account to subscribe to Security Lake data for Security Hub findings, CloudTrail logs, and VPC Flow Logs. We then provided instructions for creating, Athena views, QuickSight datasets, Q topics, named entities, and for using natural language to build dashboards and query your data. You can customize the Athena views to create, update, or delete columns and column names as needed for your use case. You can also customize the Q topics and named entities to use naming conventions and structure responses based on your organization’s needs.
If you have feedback about this post, submit comments in the Comments section below. If you have questions about this post, contact AWS Support.