Networking & Content Delivery
Using Route 53 Resolver DNS Firewall Logs with CloudWatch Contributor Insights and Anomaly Detection
Introduction
The Domain Name System (DNS) is one of the most critical components for almost any network as every service relies on a functional DNS service. Amazon Route 53 Resolver (sometimes referred to as “AmazonProvidedDNS” or the “.2/+2 resolver”) provides a highly available and scalable DNS service that customers have come to rely upon for their recursive DNS needs. Route 53 Resolver responds to DNS queries from AWS resources within an Amazon VPC for public DNS records, VPC-specific domain names, and Route 53 private hosted zones. Customers have asked for finer control over the DNS queries that resources within their VPCs are allowed to make. Customers may be concerned about DNS exfiltration (where malicious actors use DNS queries to smuggle sensitive data out of networks) or may simply want to exert more control over sites that users within their organization are allowed to access.
AWS announced Amazon Route 53 Resolver DNS Firewall (DNS Firewall) in March 2021. With Route 53 Resolver DNS Firewall, you can filter and regulate outbound DNS traffic for your VPCs. You also have the capability to protect against data exfiltration over outbound DNS by defining domain name allowlists that allow resources within your VPC to make outbound DNS requests only for the sites your organization trusts.
Route 53 DNS Firewall is integrated with Route 53 Resolver Query Logs, Amazon CloudWatch, and CloudWatch Contributor Insights that can analyze your DNS firewall’s logs. You also have access to AWS Managed Domain Lists for protections against common threats like malware and botnets.
In this post, we show how you can use CloudWatch Contributor Insights to analyze DNS Firewall log data and create time-series visualizations to provide a view of the top contributors influencing your DNS Firewall. This helps you to perform ongoing analysis for your firewall by easily surfacing outliers, top domains, top sources making bad queries (as identified by their IP addresses), and more. In addition to logs, Contributor Insights rules can also be used to create CloudWatch metrics, alarms, and dashboards. We also show how you can use Amazon CloudWatch Anomaly Detection to help you surface anomalies with minimal user intervention. Powered by machine learning and building on over a decade of experience, CloudWatch Anomaly Detection has its roots in over 12,000 internal models.
Architecture
Route 53 DNS Firewall filters and regulates outbound DNS traffic for your VPCs. It allows you to configure and log queries that use DNS Firewall rules to block, allow, or monitor domains defined in the domain list. The logs can then be sent to destinations like Amazon CloudWatch Logs, Amazon S3 and Amazon Kinesis Data Firehose. The information received from the DNS logs can be used to identify different query behaviors of your DNS firewall. In this blog post, we will use CloudWatch Logs as the log destination for the DNS Firewall logs.
For larger deployments, it is recommended to use AWS Firewall Manager service, making it easy for security administrators to identify the set of Route 53 DNS Firewall rules they wish to use and deploy across their organization, from a central place. Refer to AWS Firewall Manager docs for further details.
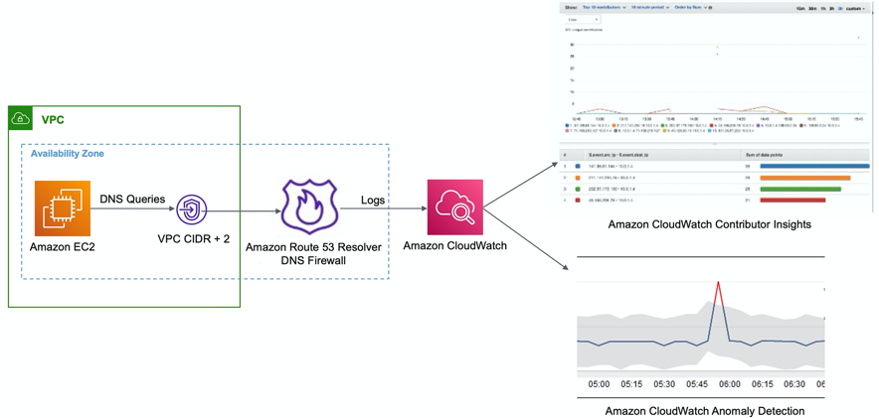
Figure 1: Route 53 DNS Firewall logs ingested into CloudWatch and analyzed through Contributor Insights and CloudWatch Anomaly Detection.
Deployment steps
The solution described in this blog post is deployed using the following steps:
- Create log group in CloudWatch Logs.
- Configure Route 53 DNS Firewall to send logs to the log group.
- Configure CloudWatch Contributor Insights.
- Configure CloudWatch Anomaly Detection.
Create a CloudWatch Logs group
In the Amazon CloudWatch console, create a log group to send the Route 53 DNS Firewall logs to, as shown in Figure 2 below:
- In the CloudWatch console, from the left navigation pane, choose Logs and then choose Log groups.
- On the Log groups page, choose Create log group.

Figure 2: Creating CloudWatch Logs group
- In Log group name, enter a name for the log group (for example, Route53 DNS Firewall Logs), as shown in Figure 3 below.
- For Retention setting, choose the approrpriate retention period. We selected the default of Never expire in this example, and then choose Create.
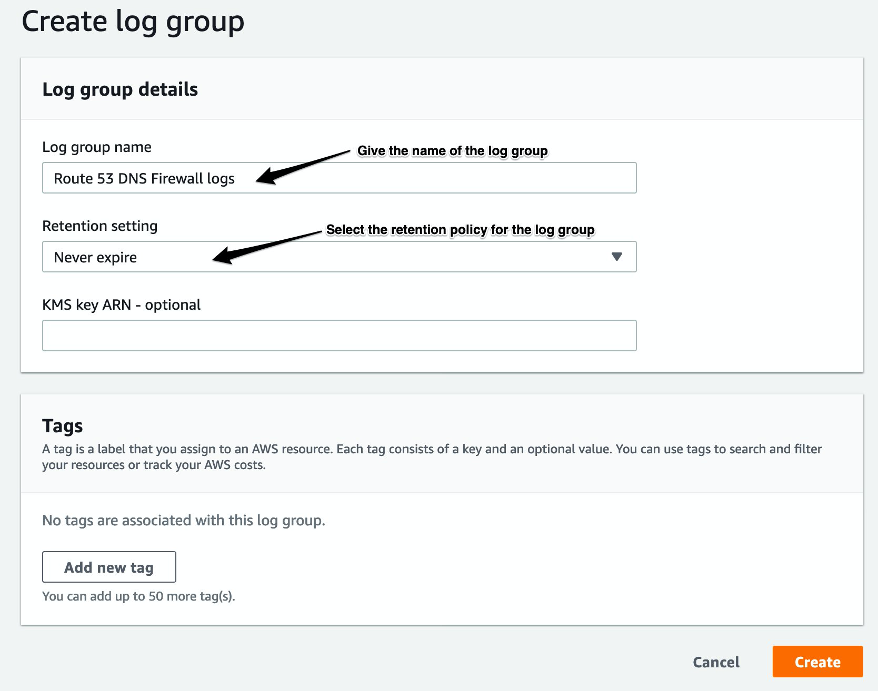
Figure 3: Creating CloudWatch Logs group details
Configure Route 53 DNS Firewall and send logs to the CloudWatch Logs group
- If you are unfamiliar with Route 53 DNS Firewall setup, follow the blog post How to Get Started with Amazon Route 53 Resolver DNS Firewall for Amazon VPC. It will help you understand how to set up the Route 53 DNS Firewall and how to associate rules to VPC(s) for which you want to inspect the DNS traffic.
- As shown below in Figure 4, we have created two example domain lists for the domains that we want to allow and block. The first domain list contains the domains which are allowed as specified by the Allow Action. The second domain list contains the domains which we don’t want our VPC to query as specified by the Block Action. It is important to note that the domain list priority dictates the order in which these rules will be processed.
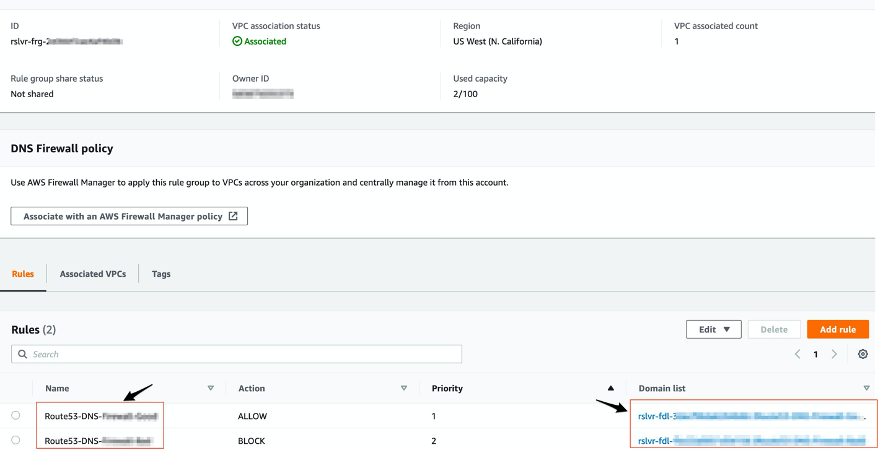
Figure 4: Route 53 DNS Firewall policy and corresponding rules
- For the Block domain list, we have configured a custom response message to return when a DNS query is blocked by the Route 53 DNS Firewall. This will help identify domains that were blocked in the Route 53 DNS Firewall logs as shown later. You could also set up a Route 53 CNAME record blocked-website.example.com pointing to a S3 bucket setup as a static website. This will direct the end user who made the query to the website explaining as to why their query was blocked.
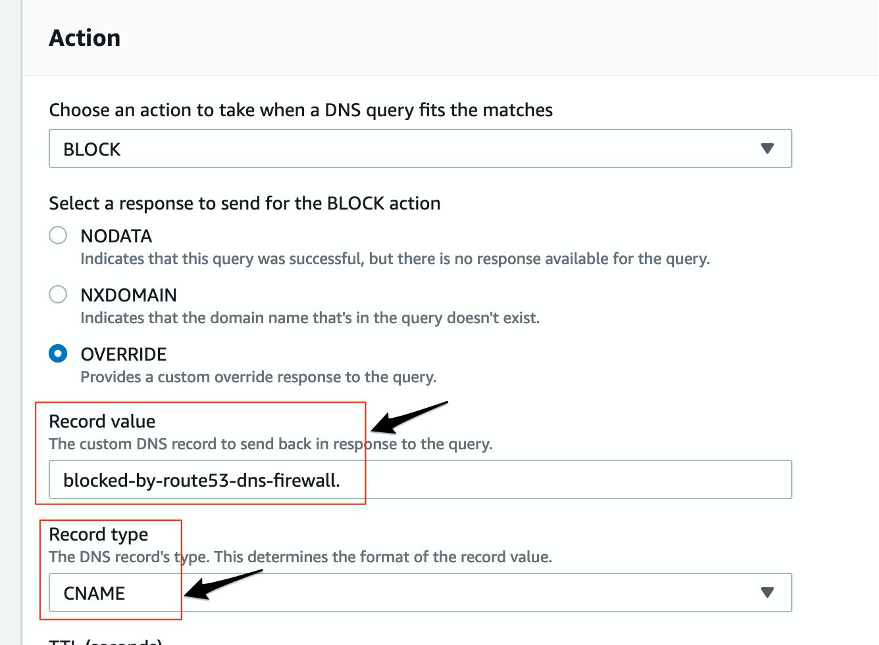
Figure 5: Route 53 DNS Firewall block policy details
- After associating the VPC with the above Route 53 DNS Firewall Rule Group, we now have the necessary steps complete for setting up the Route 53 DNS Firewall.
Next we will set up logging for the Route 53 DNS Firewall
- Go to Route 53 in the Console and click on Query Logging→Configure query logging.

Figure 6: Route 53 DNS Query logging setup
- Complete the Query logging configuration steps as shown below in Figure 7.
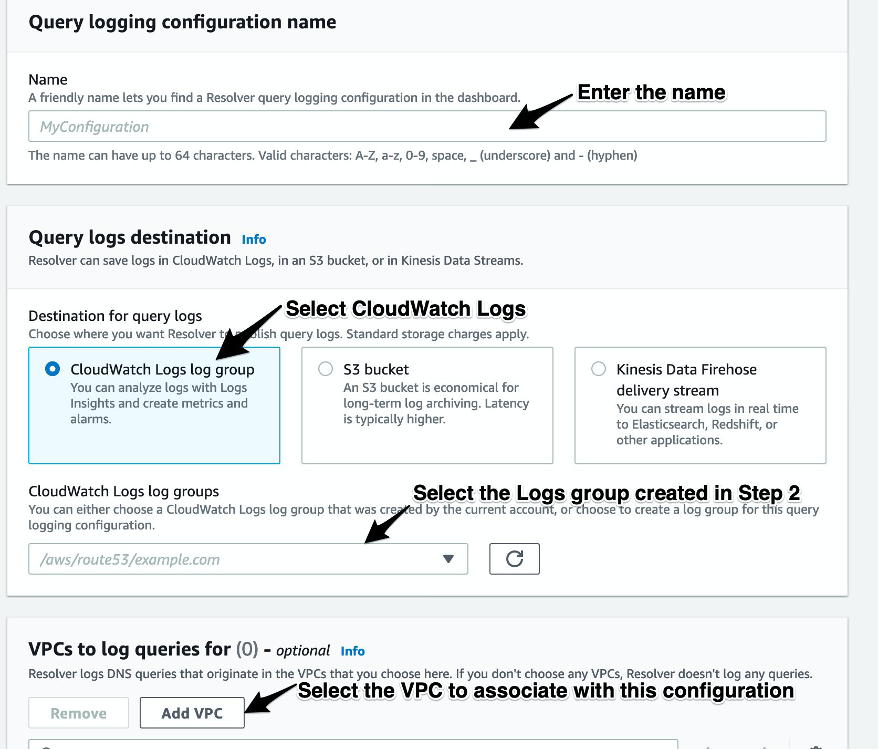
Figure 7: Route 53 DNS Firewall block policy details
- The result once complete will look like as shown in Figure 8 below

Figure 8: Route 53 DNS Firewall query logging details
Configure CloudWatch Contributor Insights
You can configure CloudWatch Contributor Insights using a built-in sample rule or a rule you create from scratch. In this example, we will show both options.
Scenario-1: Contributor Insights rule using built-in samples
- In the CloudWatch console, choose Log groups and select the log group created in the previous section.
- Choose Contributor Insights and click on Create rule.

Figure 9: CloudWatch Contributor 53 DNS Firewall query logging details
- From the Sample Rules, select Route 53 Resolver Query Logs→DNS Firewall Blocked Queries. This rule will show the queries that the DNS Firewall blocked, based on the domain list/rule group by the associated VPC.
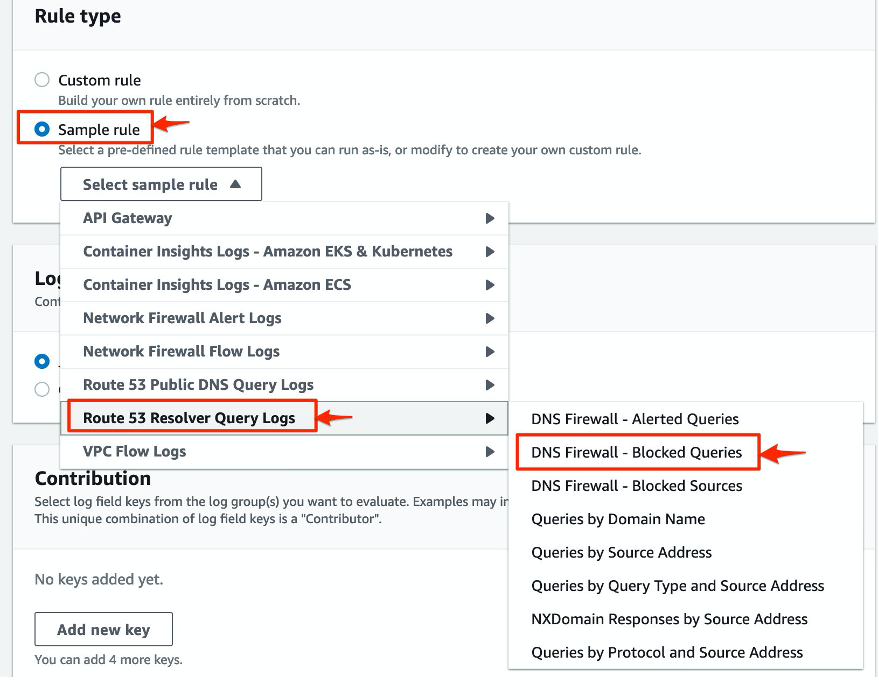
Figure 10: CloudWatch Contributor DNS Firewall Sample Rule options
- Enter the Rule name and select the Log group from the Log group(s) option. In this example, have only a single Log group. Leave the rest as default options, click Create rule to complete this step.
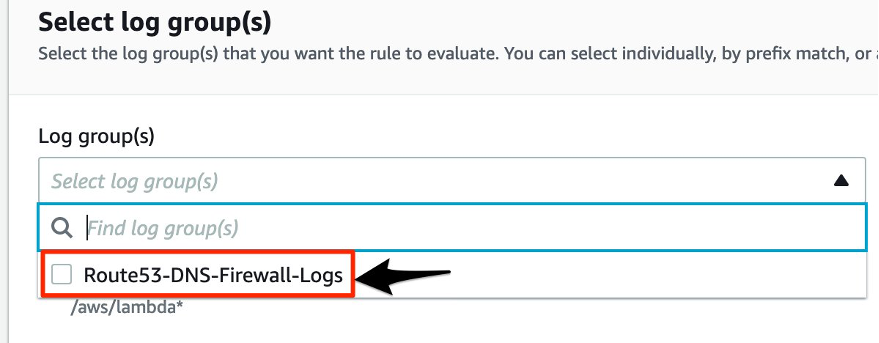
Figure 11: CloudWatch Log group selection
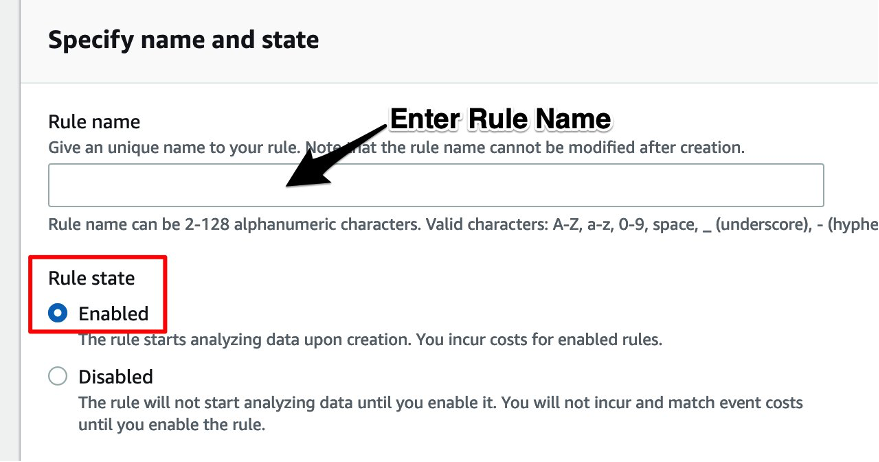
Figure 12: CloudWatch Contributor DNS Firewall Sample Rule configuration options
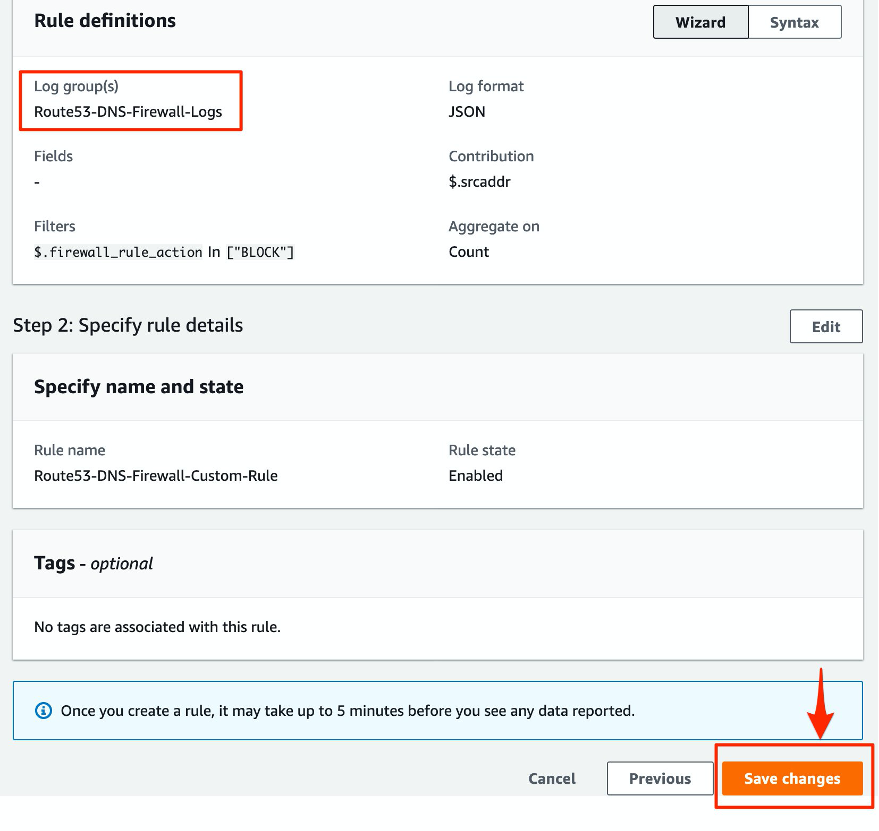
Figure 13: CloudWatch Contributor DNS Firewall Sample Rule configuration options
Scenario-2: Custom DNS Firewall rule for the top source IP addresses blocked by the Firewall
For this scenario, we use the Route 53 DNS Firewall logs that we enabled earlier. To identify the fields to use for your Contributor Insights rule, check the sample JSON entry from the log event in the CloudWatch log group setup for the DNS Firewall logs. A sample DNS Firewall Log entry is shown below.
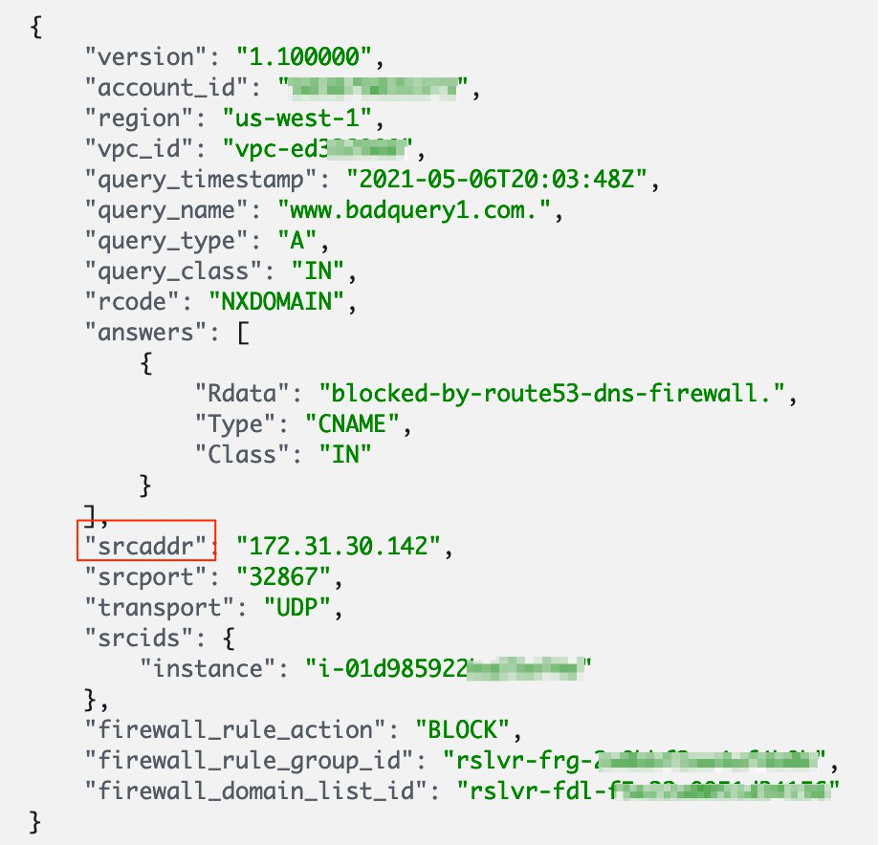
Figure 14: DNS Firewall Log output
- In the CloudWatch console, choose Contributor Insights and then choose Create rule. In the Create rule wizard, choose Custom rule. For Rule name, enter a name.
- Under Log group(s), select the name of the DNS Firewall log group you created earlier (in our example, Route53 DNS Firewall Logs.
- For Log format, choose
JSON. - Under Contribution, enter a contributor type that you want to report on. Enter
srcaddr. - For Filters→Match, enter
firewall_rule_actionandCondition: In=BLOCK. - For Aggregate on, choose
COUNT. Then select Create rule in enabled state and then choose Create.
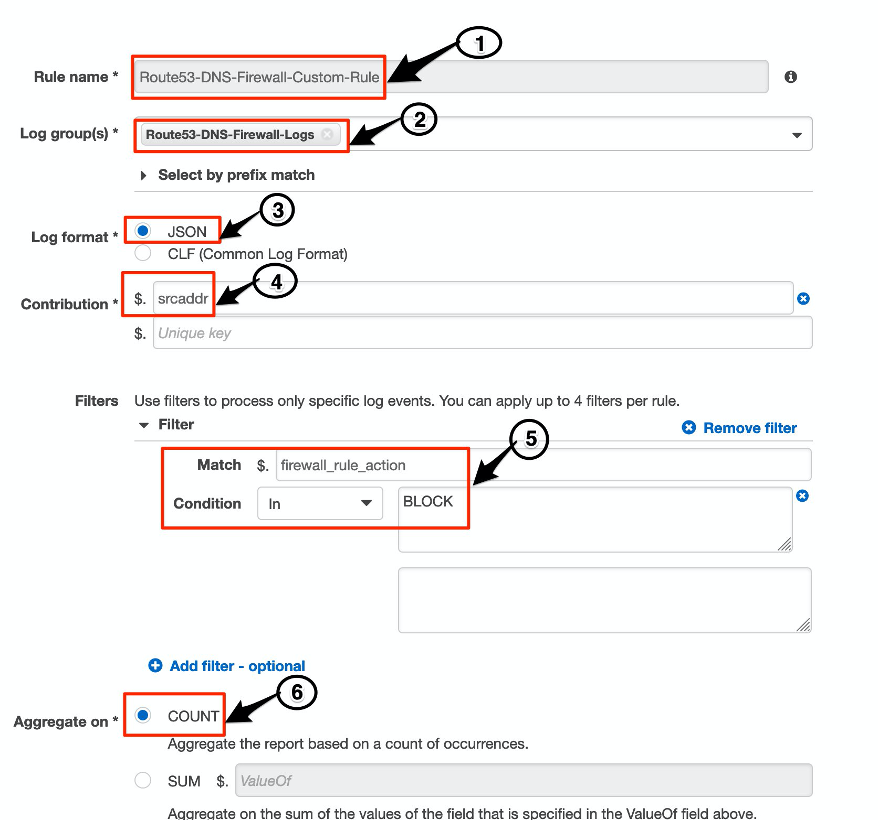
Figure 15: Contributor Insights Custom Rule Configuration setup
Once the DNS queries start to generate the logs, you can visualize the rules using graphs. Within a few minutes we see the graphs to appear for both the Sample as well as the Custom rule that we created previously.
For the Sample rule, the upper half displays the time series. The lower half ranks the top 10 contributors over the specified time period.
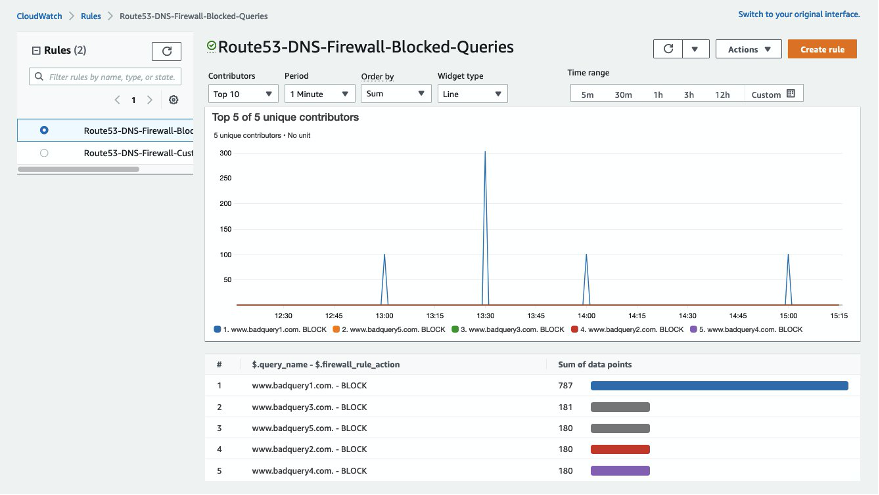
Figure 16: Contributor Insights Sample Rule visualization graph
Similarly, for the custom rule that we created, the upper half shows the time series. The lower half shows a ranking of the top 10 contributors blocked over the specified time period.
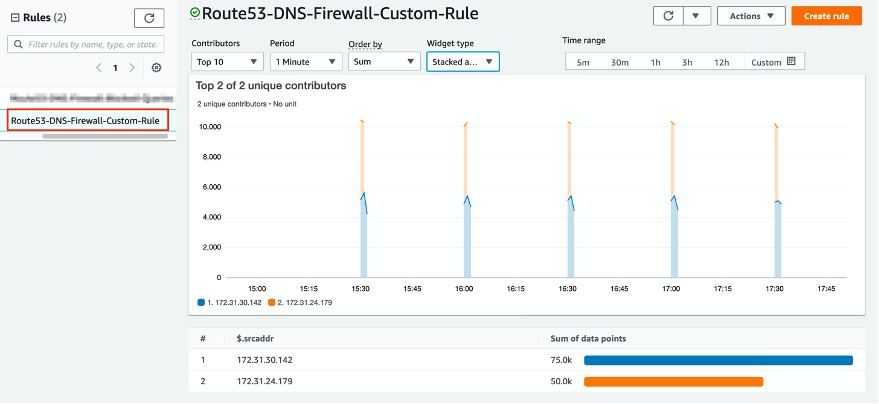
Figure 17: Contributor Insights Custom Rule visualization graph
Configure CloudWatch Anomaly Detection
CloudWatch Anomaly Detection surfaces anomalies with minimal user intervention. When you enable the feature for a specific metric, it generates a machine learning (ML) model by applying statistical and ML algorithms to continuously analyze your systems and applications to determine “normal” baselines — a range of expected values that represent normal metric behavior. In a graph with anomaly detection, the expected range of values is shown as a gray band. If the metric’s actual value goes beyond this band, it is shown as red during that time. In CloudWatch Anomaly Detection you can create alarms. Anomaly Detection alarms are useful where static thresholds are not convenient and help you to avoid manual configuration and experimentation, and can be used in conjunction with any standard or custom CloudWatch metric that has a discernible trend or pattern. For more information on how it works and supported patterns, see the documentation on using CloudWatch Anomaly Detection.
Route 53 Resolver DNS Firewall provides several CloudWatch metrics that monitor the number of DNS queries that are filtered by Route 53 Resolver DNS Firewall rule groups.
In this example, we will use one of the available DNS Firewall CloudWatch metrics, VPCFirewallQueryVolume, with CloudWatch Anomaly Detection to visualize normal VPC DNS query patterns vs any outliers.
- In the Amazon CloudWatch console, select Metrics->Route 53 Resolver→VpcId, select the VPC from the list which is associated with the Route 53 DNS Firewall in the earlier section.

Figure 18: CloudWatch VpcId Metric config
- To enable Anomaly Detection, go to Graphed Metrics and then click the wave icon on the VPCFirewallQueryVolume metric in this example as shown below in Figure 18.

Figure 19: Enabling CloudWatch VpcId Metric anomaly detection
CloudWatch Anomaly Detection uses up to two weeks of historical data for training. For the best result, at least three days of data is recommended. The model learns from your “normal” data, so it can only be as good as as the data provided. When you create the model, you have the option to exclude the “abnormal” time ranges from the training data. You can also exclude a known event such as performance testing in advance.
- We then generate some sample data/queries to simulate the normal vs abnormal behavior. The DNS queries include domains that are allowed by the DNS Firewall as well queries that are blocked by the DNS Firewall. Note that this is contrived and in practice, this will be based on your environment’s actual query patterns.
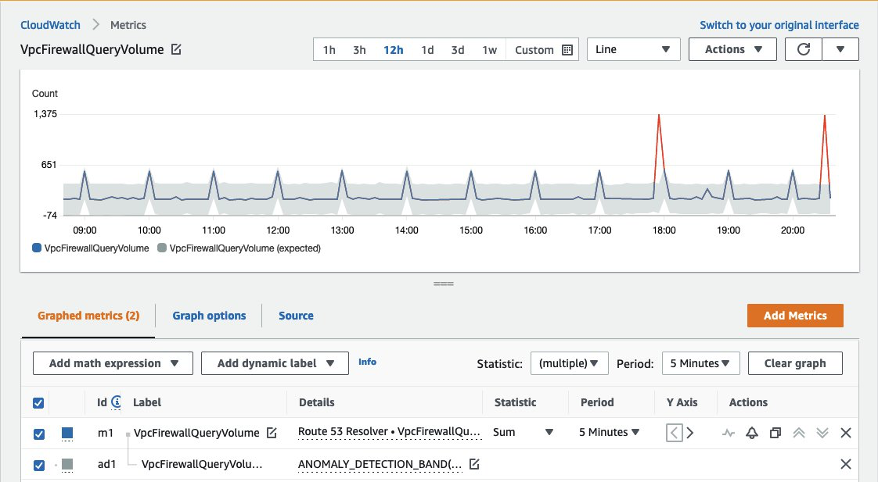
Figure 20: CloudWatch VpcFirewallQueryVolume Metric anomaly detection
- After you enable anomaly detection, the service will produce confidence bands based on your data. The Anomaly Detection confidence band represents a range of acceptable values between a high and a low value for any given data point based on the model that learns your data’s behavior. You can specify an anomaly detection threshold that CloudWatch will use with the model to determine the “normal” range of values for the metric. A larger number produces a thicker band increasing the range of expected behavior. After running for some time we observe the VPCFirewallQueryVolume graph to notice the gray normal band corresponding to the normal/expected query volume, and the red spikes corresponding to the abnormal query volume which were blocked by the DNS Firewall. These spikes could point to a potential problem at those specific times and may warrant further investigation to learn if this is legitimate traffic for your environment or maybe their is something suspicious going on there.
- (optional) As mentioned earlier, CloudWatch Anomaly detection also allows creation of alarms. To create the alarm, go to the metric as show in Figure 17 and click on the bell icon to start the workflow.
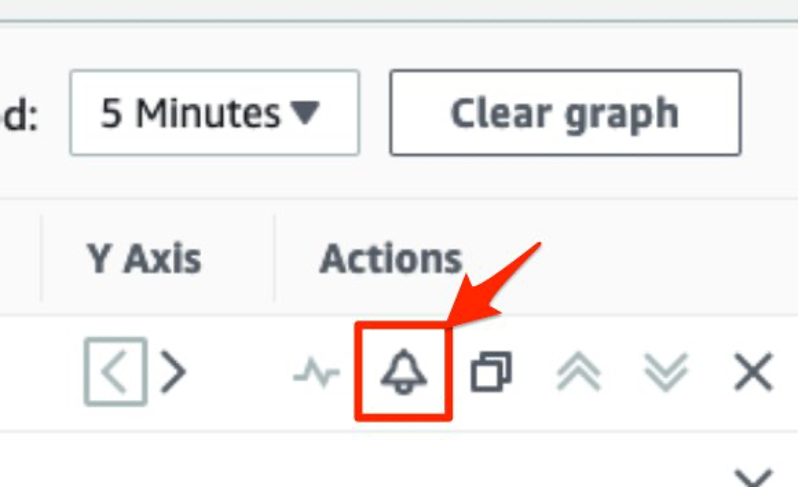
Figure 21: CloudWatch Metric alarm setup
- Select the Statistic = Average and Period = 1 minute from the drop-downs.
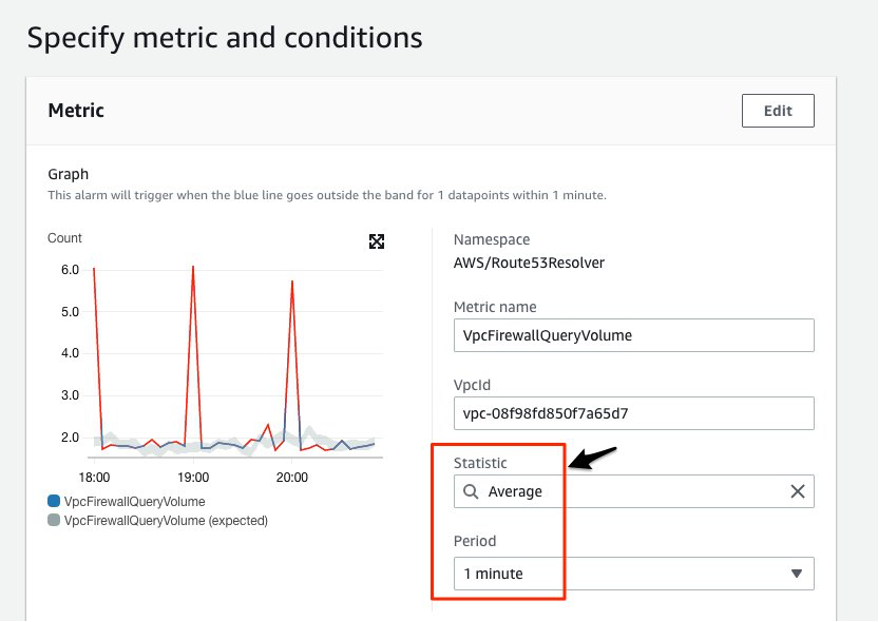
Figure 22: CloudWatch alarm metric and conditions setup
- Select the options for alarm condition as shown below with the datapoints to alarm value.
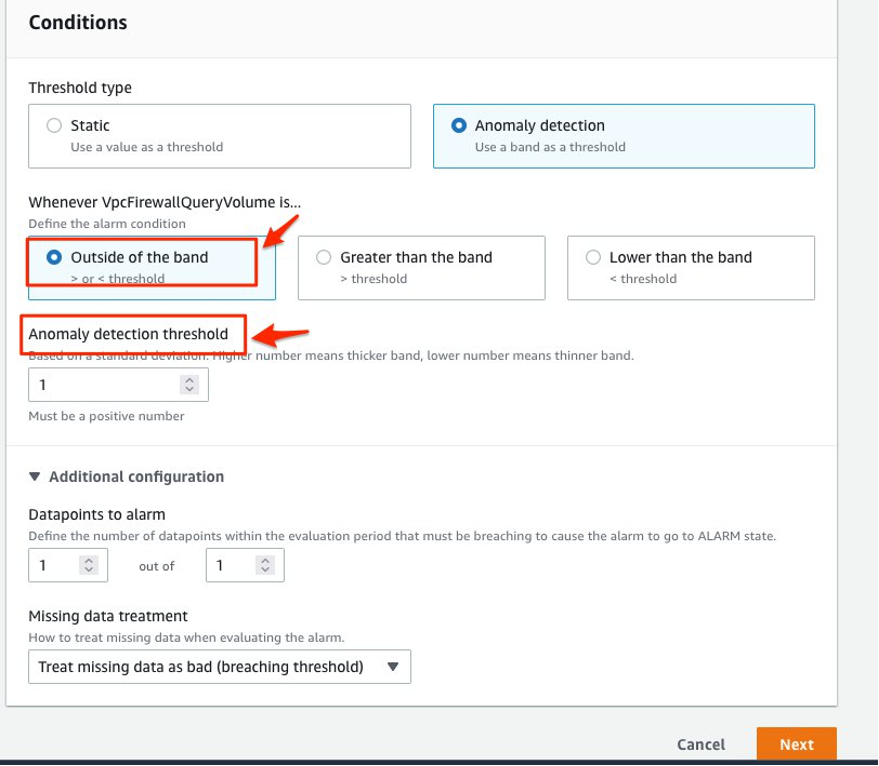
Figure 23: CloudWatch alarm conditions setup
- Under Configure actions, leave the rest as default and complete the setup. In this example, we select a SNS topic, however you can select additional targets for the alarms and the corresponding action to take. Refer to the documentation for further details.
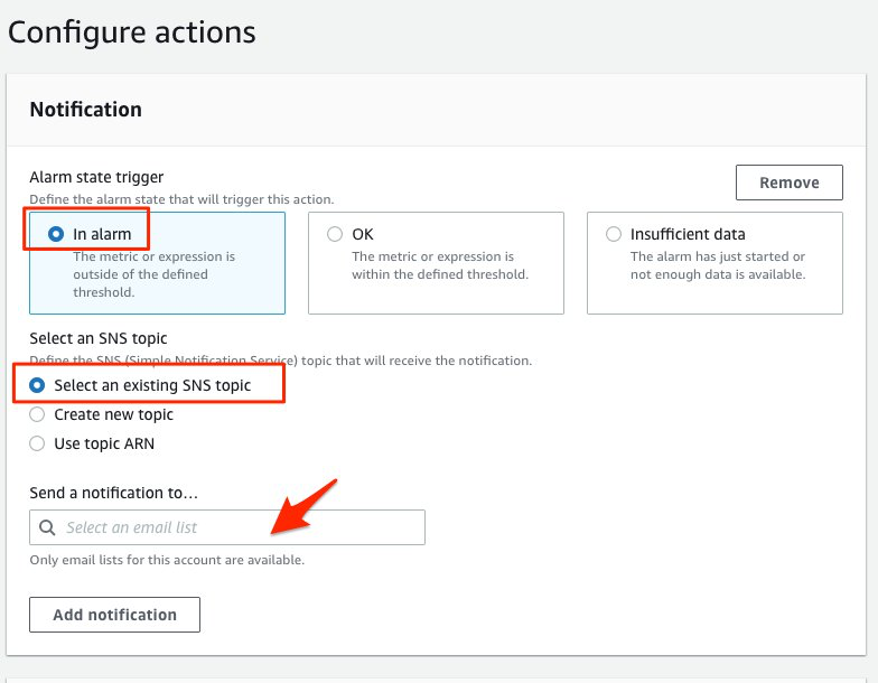
Figure 24: CloudWatch alarm actions setup
After the setup is complete, once the alarm threshold is breached, you will see the corresponding alarm in CloudWatch dashboard as well as receive an email notification triggered via the SNS topic configured previously.
Cleanup
To avoid ongoing charges, delete the resources you created. Go to the AWS Management Console, identify the resources you created (the Route53 DNS Firewall, Contributor Insights rules, CloudWatch Logs Insights rules, and alarms) and delete them.
Conclusion
In this post, we demonstrated how you can use CloudWatch Contributor Insights to analyze firewall logs from Route53 DNS Firewall. We showed you how to create custom rules to analyze the logs in real time and surface anomalies using CloudWatch Anomaly Detection. We hope this post is helpful and we look forward to hearing about how you use this feature.
For more information on Route 53 Resolver DNS Firewall, please refer our documentation.

