AWS HPC Blog
Optimizing your AWS Batch architecture for scale with observability dashboards
AWS Batch is a fully managed service enabling you to run computational jobs at any scale without the need to manage compute resources. Customers often ask for guidance to optimize their architectures and make their workload to scale rapidly using the service. Every workload is different, and some optimizations may not yield the same results for every case. For this reason, we built an observability solution that provides insights into your AWS Batch architectures and allows you to optimize them for scale and quickly identify potential throughput bottlenecks for jobs and instances. This solution is designed to run at scale and is regularly used to monitor and optimize workloads running on millions of vCPUs — in one notable case, the observability solution supported an analysis across 2.38M vCPUs within a single AWS Region.
In this blogpost, you will learn how AWS Batch works to:
- Scale Amazon Elastic Compute Cloud (Amazon EC2) instances to process jobs.
- How Amazon EC2 provisions instances for AWS Batch.
- How to leverage our observability solution to peek under the covers of Batch to optimize your architectures.
The learnings in this blogpost apply to regular and array jobs on Amazon EC2 — AWS Batch compute environments that leverage AWS Fargate resources and multi-node parallel jobs are not discussed here.
AWS Batch: how instances and jobs are scaling on-demand
To run a job on AWS Batch, you submit it to a Batch job queue (JQ) which manages the lifecycle of the job, from submission intake to dispatch to tracking the return status. Upon submission, the job is in the SUBMITTED state and then transitions to the RUNNABLE state which means it is ready to be scheduled for execution. The AWS Batch scheduler service regularly looks at your job queues and evaluates the requirements (vCPUs, GPUs, and memory) of the RUNNABLE jobs. Based on this evaluation, the service identifies if the associated Batch compute environments (CEs) need to be scaled-up in order to process the jobs in the queues.
To initiate this action AWS Batch generates a list of Amazon EC2 instances based on the jobs’ compute requirements (number of vCPUs, GPUs and memory) from the Amazon EC2 instance types you selected when configuring your CE. Depending on the allocation strategy selected, this list is provided to an Amazon EC2 Auto Scaling group or a Spot Fleet.
Once instances are created by Amazon EC2, they register with the Amazon ECS cluster connected to the CE scaling-up and the instances become ready to run your jobs. At this point, depending on the scheduling policy, the jobs waiting in RUNNABLE and fitting the free resources, transition to the STARTING state during which the containers are started. Once the containers are executing, the job transition to the state RUNNING states. It remains there until either successful completion or it encounters an error. When there are no jobs in the RUNNABLE state and instances stay idle, then AWS Batch detaches the instance from the Compute Environment and requests for Amazon ECS to deregister the idle instances from the cluster. AWS Batch then terminates them, and scales-down the EC2 Auto Scaling group or the Spot Fleet associated to your CE.
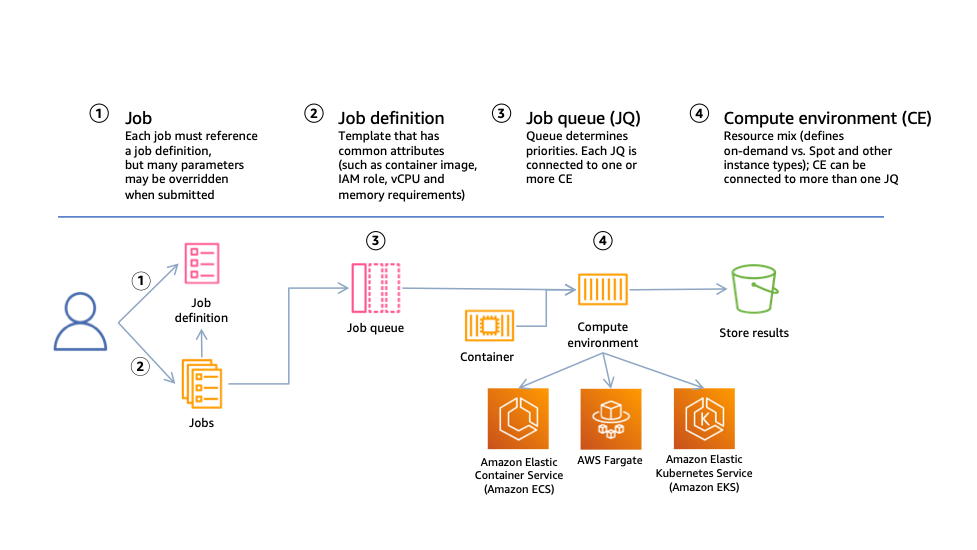
Figure 1: High level structure of AWS Batch resources and interactions. The diagram depicts a user submitting jobs based on a job definition template to a job queue, which then communicates to a compute environment that resources are needed. The compute environment resource scales compute resources on Amazon EC2 or AWS Fargate and registers them with a container orchestration service, either Amazon ECS or Amazon Elastic Kubernetes Service (Amazon EKS). In this post we only cover Amazon ECS clusters with EC2 instances.
Jobs placement onto instances
While the CE are scaling up and down, AWS Batch continuously asks Amazon ECS to place jobs on your instances by calling the RunTask API. Jobs are placed onto an instance if there is room to fit them. If a placement cannot be fulfilled and the API call fails, Amazon ECS provides a reason logged in AWS CloudTrail, such as a lack of available resources to run the job. The rate of successful API calls can help to compare two architectures on how fast jobs are being scheduled to run.
How instances are provisioned
You have seen how instances are requested by AWS Batch, we will now discussed on how they are provisioned. Instance provisioning is handled by Amazon EC2, it picks instances based on the list generated by AWS Batch and the allocation strategy selected when creating the CE.
With the allocation strategy called BEST_FIT (BF), Amazon EC2 pick the least expensive instance, with BEST_FIT_PROGRESSIVE (BFP) pick the least expensive instances and pick additional instance types if the previously selected types are not available. In the case of SPOT_CAPACITY_OPTIMIZED, Amazon EC2 Spot selects instances that are less likely to see interruptions.
Why optimize the Amazon EC2 instance selection in your Compute Environments?
Understanding how AWS Batch selects instances helps to optimize the environment to achieve your objective. The instances you get through AWS Batch are picked based the number of jobs, their shapes in terms of number of vCPUs and amount of memory they require, the allocation strategy, and the price. If they have low requirements (1-2 vCPUs, <4GB of memory) then it is likely that you will get small instances from Amazon EC2 (i.e., c5.xlarge) since they can be cost effective and belong to the deepest Spot instances pools. In this case, you may provision the maximum number of container instances per ECS Cluster (sitting beneath each Compute Environment) and therefore potentially hinder your ability to run at large scale. One solution to this challenge is to use larger instances in your Compute Environments configuration and help you achieve the desired capacity while staying under the limit imposed by ECS per cluster. To solve that, you need visibility on the instances picked for you.
Another case where observability on your AWS Batch environment is important is when your jobs need storage scratch space when running. If you set your EBS volumes to a fixed size, you may see some jobs crash on larger instances due to DockerTimeoutErrors or CannotInspectContainerError. This can be due to the higher number of jobs packed per instance which will consume your EBS Burst balance and process IO operations at a slow pace which prevents the Docker daemon from running checksums before it times out. Possible solutions are to increase the EBS volume sizes in your launch template, or prefer EC2 instance with instance stores. Having the visibility to link job failures to instance kinds is helpful in quickly determining the relevant solutions.
To help you in understanding and tuning your AWS Batch architectures, we developed and published a new open-source observability solution on GitHub. This solution provides metrics that you can use to evaluate your AWS Batch architectures at scale. The metrics include: the instances provisioned per compute environment and their types, the Availability Zones where they are located, the instances your jobs are scheduled on, how your jobs transition between states, and the placement rate per instance type.
We will discuss this observability solution in detail and demonstrate how it can be used to understand the behavior of your compute environment using a given workload. The examples provided here can be deployed on your account using Amazon CloudFormation templates.
AWS Batch observability solution
This open-source observability solution for AWS Batch is a serverless application that collects events from different services, combines them into a set of Amazon CloudWatch metrics and presents them in a set of dashboards. This solution is an AWS Serveless Application Model (SAM) template that you can deploy on an AWS account using the SAM CLI. The application is self-contained and can monitor AWS Batch architectures running from a few instances to dozens of thousands. The architecture below provides details of the SAM application. For instructions on how to install the solution, please refer to the Github repository.
SAM application architecture
The SAM application collects data points from your AWS Batch environment using CloudWatch events. Depending on their nature, these events trigger AWS Step Functions to capture the relevant data, add it to Amazon DynamoDB tables, and write the metrics using the CloudWatch embedded metric format. These metrics are aggregated in Amazon CloudWatch using a SEARCH expression and displayed onto dashboards that you can use to visualize the behavior of your workloads. The architecture diagram of the application is shown on Figure 2.
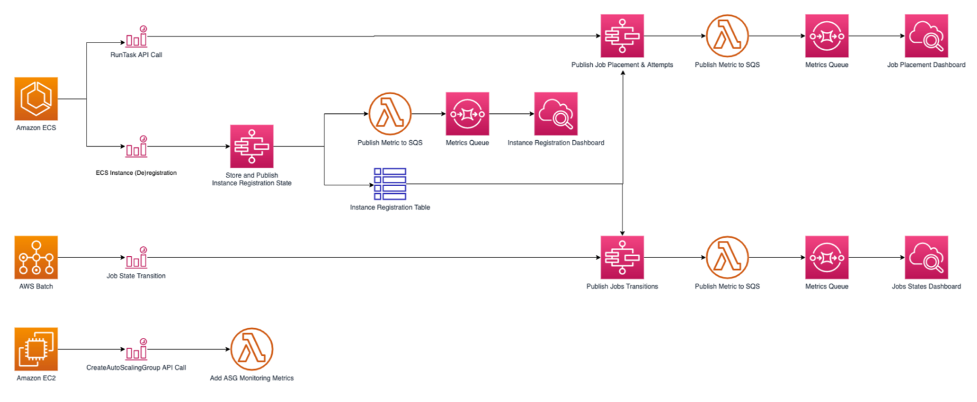
Figure 2: SAM application architecture. The diagram depicts how the different API calls made by Amazon ECS, AWS Batch, and Amazon EC2 are collected and displayed in the dashboards. Amazon ECS has the RunTask API call and the EC2 instance registration/deregistration monitored which trigger AWS Step Functions which trigger AWS Lambda to publish the metrics to a queue and then the respective dashboards. AWS Batch has the Job State Transition trigger Step Functions to publish in the transitions in the dashboard. Amazon EC2’s CreateAutoScalingGroup API call uses Lambda to monitor the Auto Scaling group metrics.
Using Amazon CloudWatch Events with AWS Batch
This solution only uses events generated by services instead of calling APIs to describe the infrastructure. This is a good practice when running at large scale to avoid potential API throttling when trying to retrieve information from thousands of instances or millions of jobs.
The events captured by the serverless application are the following:
- ECS container instance registration and deregistration: When an instance reaches the RUNNING state, it registers itself with ECS to become part of the resource pool where your jobs will run. When an instance is removed, it deregisters and will no longer be used by ECS to run jobs. Both API calls contain information on the Instance Kind, its resources (vCPUs, Memory), the Availability Zone where the instance is located, the ECS cluster and the container instance Instance registration status is collected in an Amazon DynamoDB table to determine the EC2 instance, Availability Zone and ECS cluster used by a job using the container instance ID.
- RunTask API calls are used by Batch to request the placement of jobs on instances. If successful, a job is placed. If an error is returned, the cause can be a lack of available instances or resources (vCPUs, Memory) to place a job. Calls are captured in an Amazon DynamoDB table to associate a Batch job to the container instance it runs on.
- Batch jobs state transitions trigger an event when a job transitions between states. When moving to the
RUNNINGstate, theJobIDis matched with the ECS instances and RunTask DynamoDB tables to identify where the job is running.
The serverless application must be deployed on your account before going to the next section. If you haven’t done so, please follow the documentation in the application repository.
Understanding your Batch architecture
Now that you can visualize how AWS Batch acquires instances and places jobs, we will use this data to evaluate the effect of instance selection on a test workload.
To demonstrate this, you will deploy a set of AWS CloudFormation templates as described in Part I of this workshop. The first deploys a VPC stack and the second deploys an AWS Batch stack (see Figure 3). Then you will create and upload a container image on Amazon ECR and submit two Batch array jobs of 500 child jobs each that will use the CPU for a period of 10 minutes per job.
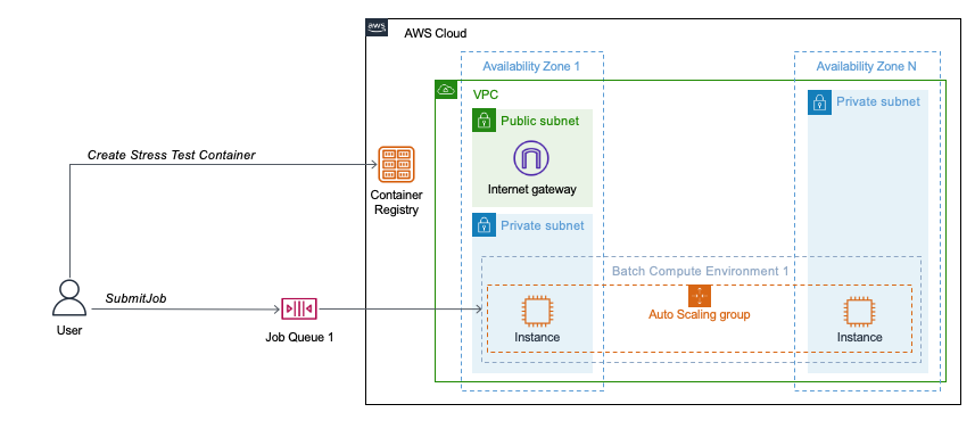
Figure 3: AWS Batch architecture for the tests workloads. This diagram depicts the environment deployed by the AWS CloudFormation templates. The VPC stack deploys a VPC in 2 or more Availability Zones. In one Availability Zone you have both a public and private subnet, in the rest only a private subnet. An internet gateway is created in the public subnet. The Batch stack creates the Amazon Elastic Container Registry, the job queue and the compute environment spanning the private subnets.
Understanding the instance selection of your Compute Environments
When creating a Batch compute environment, you can select the type and size of instances that will be used to run your jobs (e.g. c5.9xlarge and c5.18xlarge), use entire families of instances (e.g., c5, m5a) or let AWS Batch pick instances for you using the optimal setting. When running jobs, Batch will build a list of instances from your initial selection that can fit your jobs (number of vCPUs, GPUs and memory); then AWS Batch will ask Amazon EC2 to provide the capacity using this refined list. Amazon EC2 then pick instances based on the purchasing model and allocation strategy.
In this scenario, you will explore the instance selection for one compute environment called CE1. The objective is to demonstrate how you can use the serverless application to identify which instances are picked so you can see how batch performs instance selection for a workload provided.
CE1 is configured to pick instances from the c5, c4, m5, m4 Amazon EC2 instance families regardless of the instance and uses the Spot Capacity Optimized allocation strategy.
The test workload consists of two Batch array jobs of 500 child jobs for a total of 1,000 jobs. Each individual job requires 2 vCPUs, 3192MiB of memory and has a fixed duration of 10 minutes during which it uses its allocated cores at 100%.
Run and visualize your Workload on CE1
While your workload is running, look at the vCPU and instance capacity on the dashboard Batch-EC2-Capacity. In the run below, the CE acquired a maximum of 766 instances and provided a peak of 2,044 vCPUs. It also shows that 18 minutes were necessary to run the 1,000 jobs. This runtime can vary depending on the number of instances acquired. The dashboard reflects some missing data near the end of the run but it has no impact on the processing of the jobs.
Dashboard Batch-ECS-RunTaskJobsPlaced (Figure 4) has 2 plots where you can compare the Desired Capacity requested by Batch and the In-service Capacity as maintained by ECS. When the workload is optimal, they should mirror each other closely.
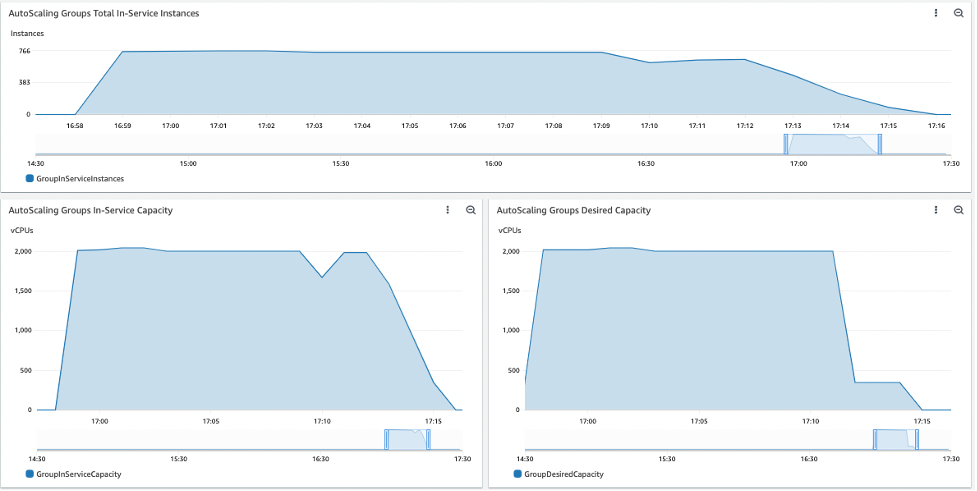
Figure 4: Dashboard Batch-ECS-RunTaskJobsPlaced
To identify which instance types were launched, in which Availability Zone they were launched, and when they joined the ECS cluster, open the dashboard Batch-ECS-InstancesRegistration (Figure 5). In this case, the instances acquired were c5.large, c5.xlarge, c5.2xlarge, c4.xlarge as they can all accommodate the jobs and were selected by the SPOT_CAPACITY_OPTIMIZED allocation strategy as they belong to the deepest available instance pools.
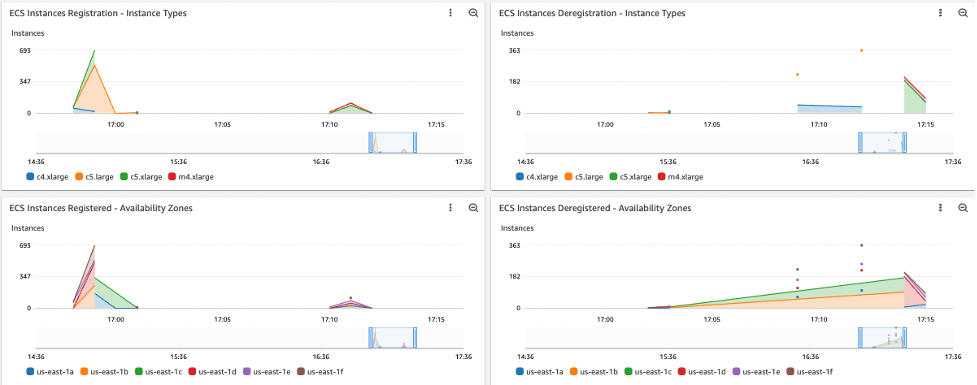
Figure 5: Dashboard Batch-ECS-InstancesRegistration
Dashboard Batch-Jobs-Placement (Figure 6) shows when jobs are placed onto the instances (moving states from RUNNABLE to RUNNING), on which instance type and in which Availability Zone. In this run, the peak task placement rate was 820 tasks per minute.
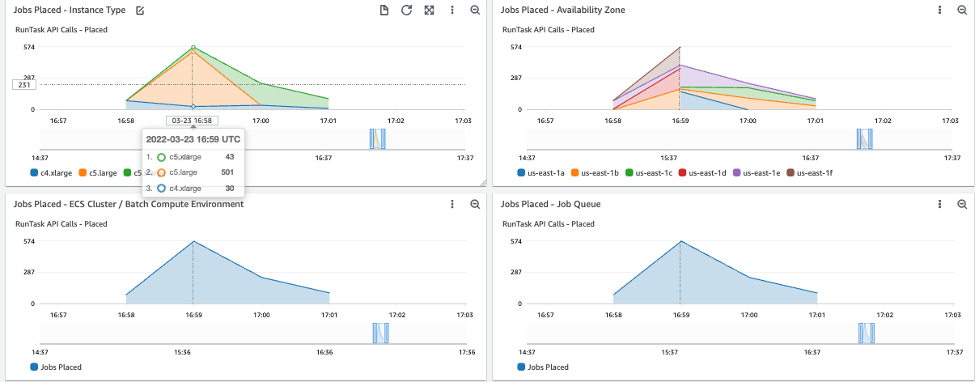
Figure 6: Dashboard Batch-Jobs-Placement
There are other additional plot and Dashboards available to explore. By taking the time and studying the dashboards in this way for your workload, you can gain an understanding of the behavior of AWS Batch based on these CE1 settings. By modifying the settings, or running a different workload, you can continue to use these dashboards to gain deeper insights into how each workload will behave.
Summary
In this blogpost, you learned how to use runtime metrics to understand an AWS Batch architecture for a given workload. Better understanding your workloads can yield many benefits as the workload scales.
Several customers in Health Care & Life Sciences, Media Entertainment and Financial services industry have used this monitoring tool to optimize their workload for scale by reshaping their jobs, refining their instance selection and tuning their AWS Batch architecture.
There are other tools that you can use to track the behavior of your infrastructure, for example the EC2 Spot Interruption Dashboard. Finally, since this solution is open-source you are free to add other custom metrics you find useful.
To get started with the AWS Batch open-source observability solution, visit the project page on GitHub.