AWS Database Blog
Best Practices on how to configure Monitoring and Alerts for Amazon RDS for SQL Server: Part 2
AWS provides multiple tools, techniques and metrics to monitor and alarm on, giving you a view over what is going on in the Amazon Relational Database Service (Amazon RDS) for SQL Server and how to optimize the operation and performance of RDS for SQL Server Instance. In our previous post, we presented an overview of the monitoring tools provided by AWS, important metrics to analyze, and important events to subscribe to.
Customers want to shorten the process of creating important Amazon CloudWatch Alarms. In this post, we provide a CloudFormation template and steps to create CloudWatch Alarms and SNS subscription to send email notifications about Amazon RDS for SQL Server for High CPU Utilization, Low Freeable Memory, High Read Latency, High Write latency and RDS Events.
B.1 Prerequisites
To setup the monitoring and alerting configuration on your RDS for SQL Server, you must complete the following prerequisites:
- An AWS account with privileges to deploy the necessary resources.
- Create an RDS for SQL Server Instance and note down the name (e.g., primary-rds-sql-server)
- A terminal or a command prompt configured with AWS CLI. Refer Configuring the AWS CLI on how to do it.
Note: Creating CloudWatch Alarms may incur cost. Please visit Amazon CloudWatch pricing for more details.
B.2 Create SNS topics using CloudFormation template
- Download the CloudFormation YAML file named
SQLServerRDSMetricsAndAlarm.YAMLand save it at a location of your choice. - Create a parameter file named
RDSSQLServerSNSEventsAlarmParameters.jsonand copy the following content into the file and save it at the same location as step 1:
Note: Make sure to replace the email address and RDS for SQL server Instance name accordingly
- Open Terminal on Linux/MacOS or Command Prompt on Windows and navigate to the location where
SQLServerRDSMetricsAndAlarm.YAMLandRDSSQLServerSNSEventsAlarmParameters.jsonare saved. - Run the following command using AWS CLI:
- Verify that the CloudFormation Stack is created by opening AWS Management Console and navigating to CloudFormation console as shown below:

B.3 Subscribe to SNS topics to receive alerts for Important RDS for SQL Server Metrics and Events
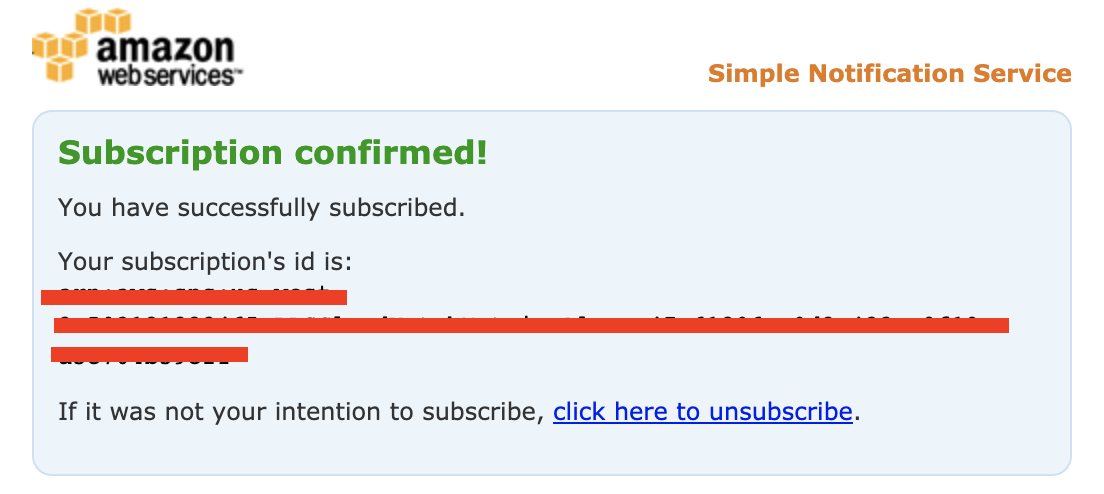
- Once the Stack creation is successful, you will receive an email to confirm SNS Subscription.

- Confirm the Subscription.

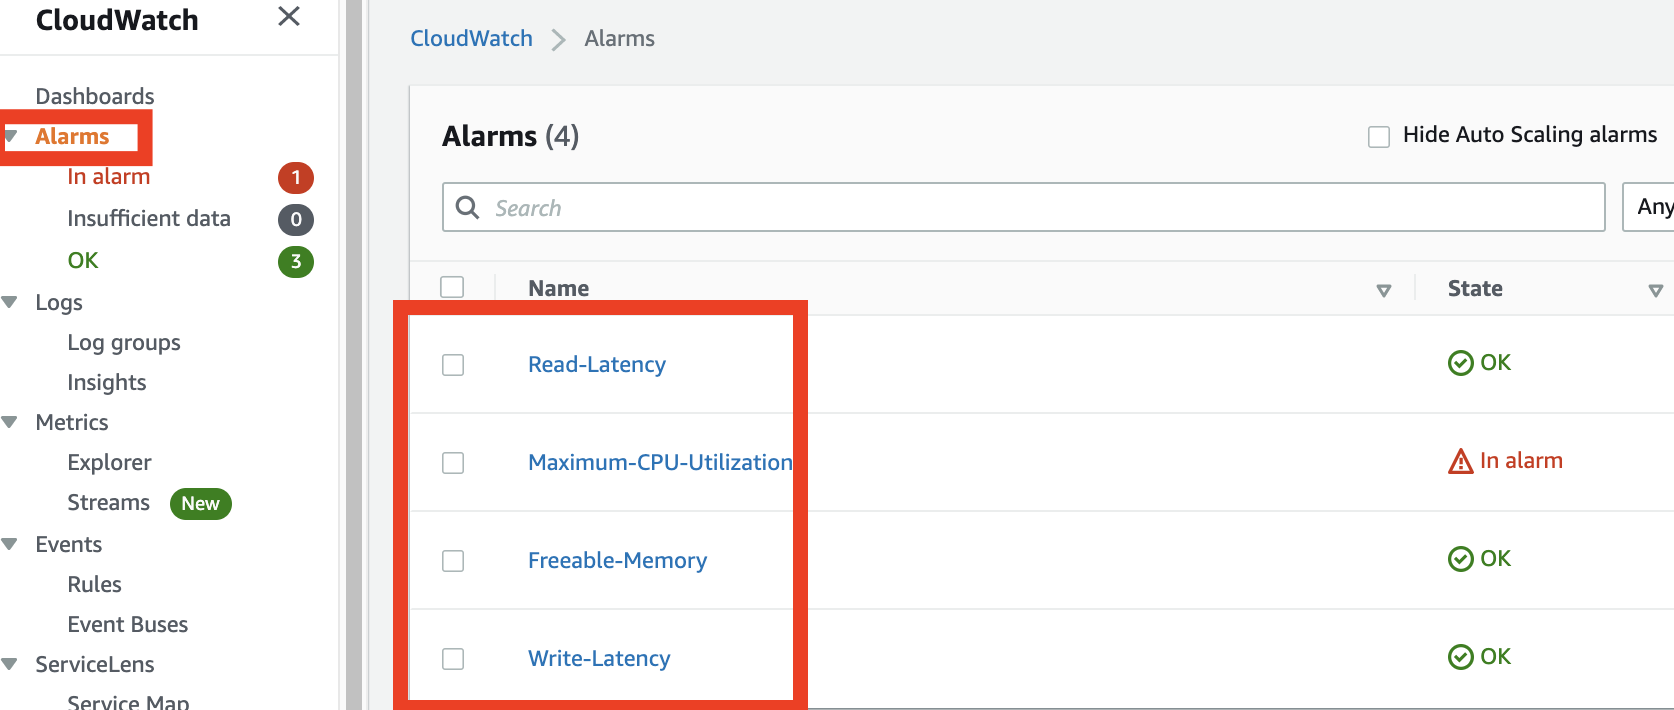
- Navigate to CloudWatch console and verify if the following alarms are created:
-
- Read-Latency
- Maximum-CPU-Utilization
- Freeable-Memory
- Write-Latency
-
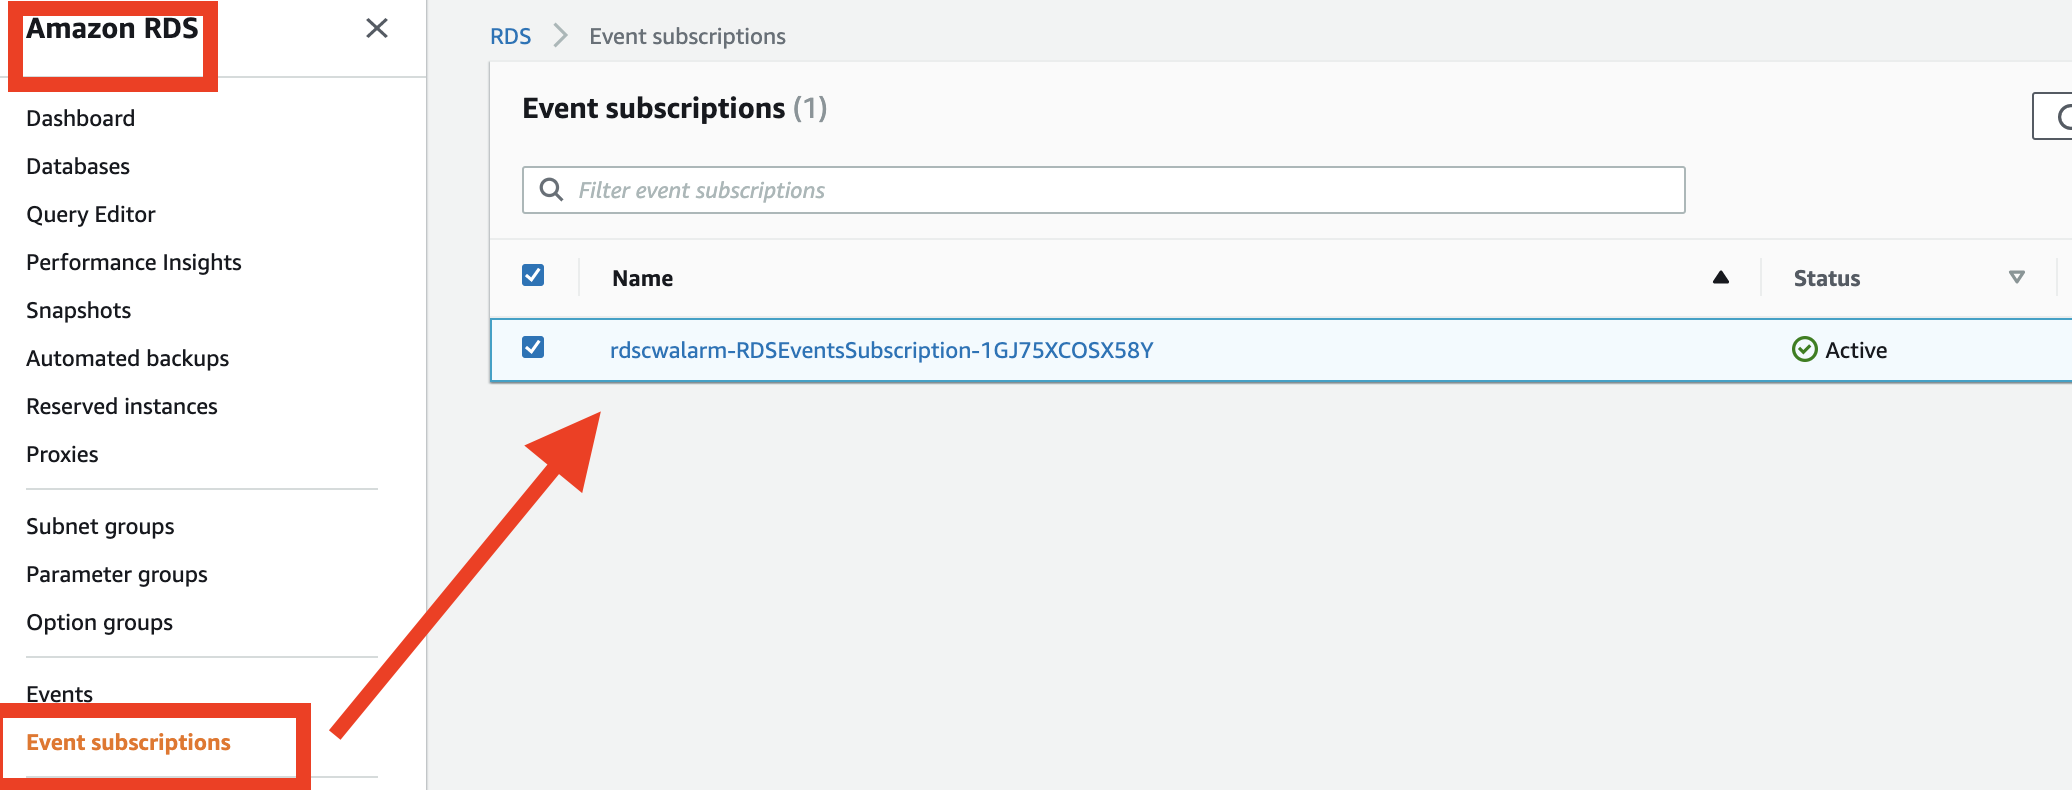
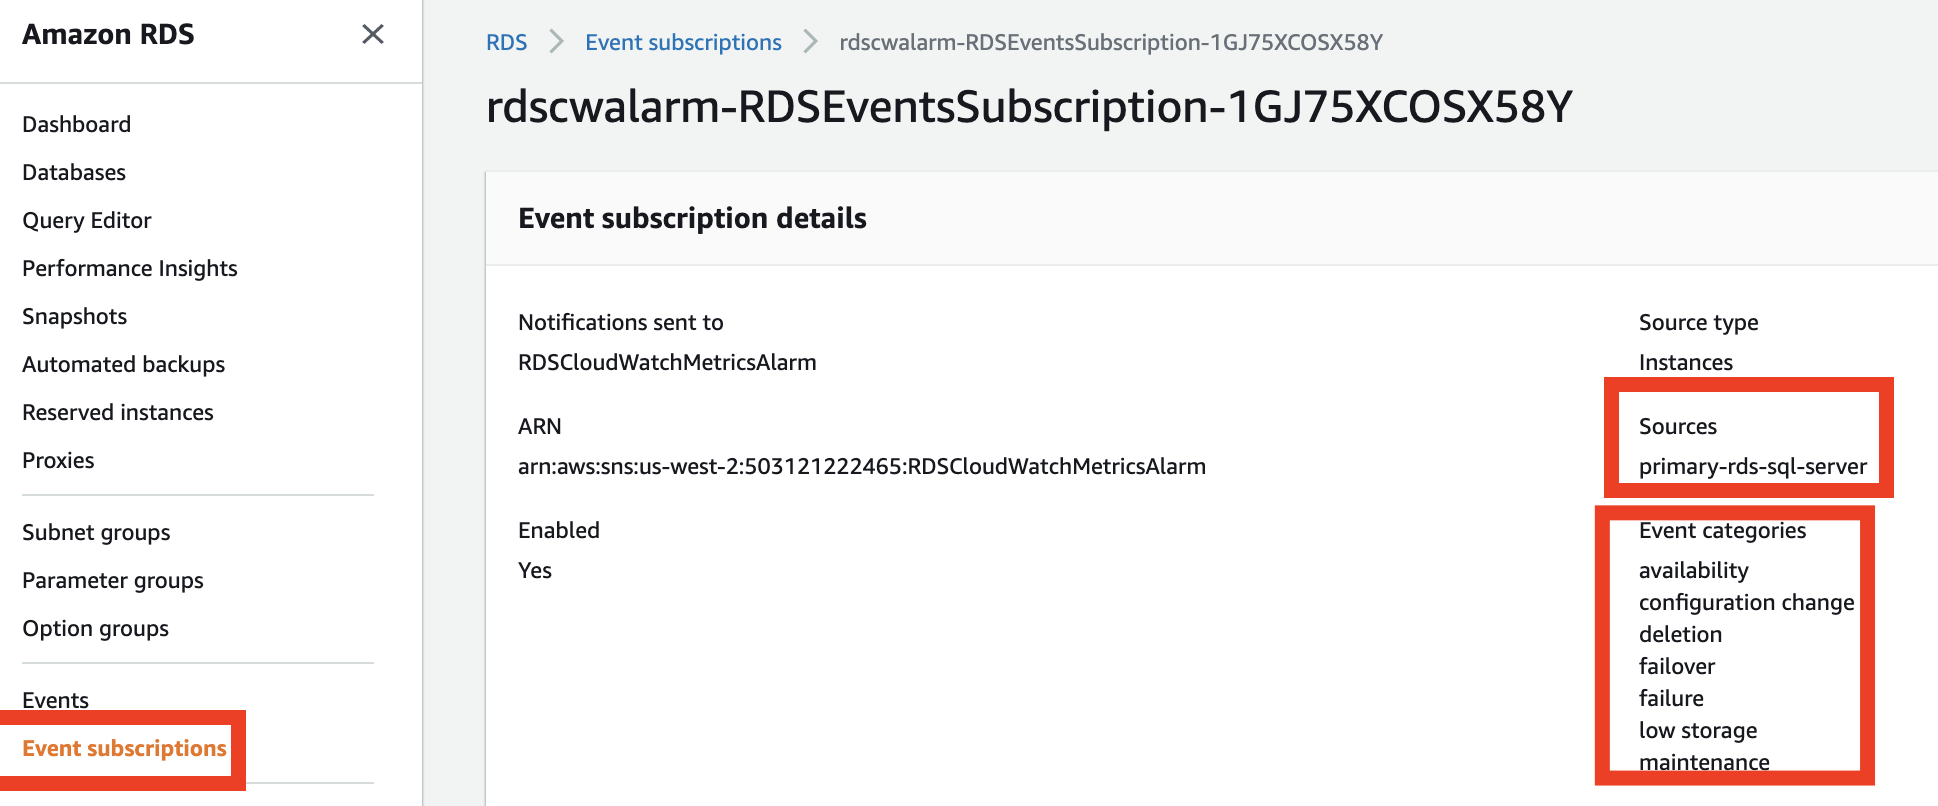
- Navigate to Amazon RDS Console to locate the RDS Event Subscription.


- As soon as any threshold is breached, an email notification is sent. For e.g., as shown in the following screenshot, a subscriber received an email because the CPU exceeded the maximum CPU utilization threshold.

Clean up
To avoid incurring future charges, delete the resources you created in this walkthrough.
Open the AWS CloudFormation Console and search for the stack name rdscwalarm and then delete the stack to remove all the resources created.
Conclusion
It is very important to observe the events occurring on RDS for SQL Server Instance, as well as monitor how RDS for SQL Server Instances are performing. As there are a lot of different ways to get information about the events and the metrics, it is useful to know the important metrics and events. In the previous post of this series, we have discussed various database monitoring tools provided by AWS, Important Metrics to analyze and alert on when the metrics breach baseline threshold and Important Events to subscribe to.
You can also read more about monitoring an Amazon RDS DB instance. Please do try out the solution provided and if you have any comments or questions, leave them in the comments section.
About the Author
 Vikash Singh is a Database Consultant with the Professional Services team at Amazon Web Services. He works as a database migration consultant to provide Amazon customers with technical guidance to migrate their on-premises databases to AWS.
