AWS Database Blog
How to use CloudWatch metrics to decide between General Purpose or Provisioned IOPS for your RDS database
July 2023: This post was reviewed for accuracy.
In this blog post, I talk about how you can use Amazon CloudWatch metrics to understand when you might benefit from provisioned IOPS, also known as IO1 volumes, for highest performance mission-critical database workloads. I start by setting up a test case that simulates a nonbursting consistent high-write workload. I compare performance between a database with general purpose storage, also known as GP2 volumes, that balances price and performance, and a database with IO1 volumes. I then show you what the corresponding CloudWatch metrics reveal, and also the workload performance results.
A few months ago, the AWS Database Blog featured a great blog post that explained burst balance and baseline performance with GP2 volumes, Understanding burst vs. baseline performance with Amazon RDS and GP2. GP2 volumes are easy to provision, easy to use, and inexpensive. Because they deliver a burst of performance when needed, they perform well for sporadic workloads or applications that can tolerate potential waits. Environments like development, functional testing, and sandboxes have no trouble using GP2 volumes even under occasional load. For consistently demanding database workloads, provisioned IOPS volumes deliver sustained performance and throughput at the level that you provision.
Prerequisites
Before you get started, carefully review the blog post that I mention just previously on GP2 burst performance, Understanding burst vs. baseline performance with Amazon RDS and GP2.
If you want to run through the code in this post, create two equal Amazon RDS for MySQL databases in your account. One instance should have GP2 volumes, and one instance should have IO1 volumes. You can download the scripts and code for this post from this GitHub repository.
Test scenario—same volume size, different IOPS
Amazon RDS makes it easier to set up, operate, and scale a relational database in the cloud. It provides cost-efficient, resizable capacity for industry-standard relational databases and automatically manages common database administration tasks. With Amazon RDS, you can scale CPU, storage, and IOPS independently. When you need more, you can add more.
Amazon RDS also makes it easy to track the performance and health of your DB instance. You can subscribe to Amazon RDS events to be notified when changes occur with a DB instance, DB snapshot, DB parameter group, or a DB security group. For more information, see Monitoring Amazon RDS in the Amazon RDS User Guide.
You can also use Amazon CloudWatch to monitor the performance and health of a DB instance; performance charts are shown on the Amazon RDS console. CloudWatch pricing includes Basic Monitoring metrics (at five-minute frequency) for Amazon RDS DB instances. In this post, I use CloudWatch metrics to help understand how the test workload performed.
Instance details
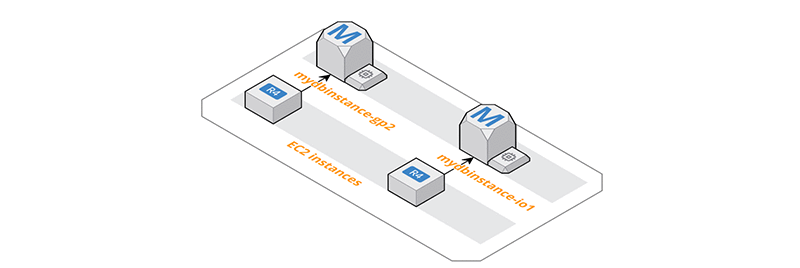
To simplify my testing, I used db.m4.2xlarge RDS for MySQL instances. The instances were each provisioned with 400 gigabytes of storage. The IO1 instance was provisioned with 5,000 provisioned IOPS. The GP2 instance has a base rate of 1,200 IOPS (3 IOPS per GB) and can burst to 3,000 IOPS as needed. I also created two Amazon EC2 instances with access to the two RDS for MySQL instances. The EC2 instances were used to connect to the databases and execute the tests. Using two instances allowed me to isolate the workloads from each other.
I created one simple table in MySQL with a few different data types that can be easily populated with random data. Inserts against a single table, if the structure is challenging enough, and the number of workers high enough, can generate load to simulate high I/O.
To simulate an I/O-intensive workload, I used a number of schema design antipatterns:
- A primary key with random character values.
- Long character columns with random values.
- Secondary indexes covering the full length of long columns with random values.
- Secondary indexes containing unnecessary columns.
Such design features are considered incorrect in real-world applications. For the purposes of our test, they help generate high I/O activity with relatively simple queries.
To generate the load on the databases and simulate lots of little inserts, I wrote a Python script. This script connects to the database, inserts 100,000 rows one at a time, commits after every 500 rows, and then exits. The bulk of the work in the Python script is done by run_mysql(workload) where workload is the first command line argument of either insert or query. You can download the complete text of the Python script from the repository listed preceding.
For my tests, I called the program with 250 threads each performing 100,000 inserts. You can download the code that I used and modify it for your own purposes. To change the number of inserts performed in your environment, edit line 80 of the file submit_workload.py. The second argument of the script controls the number of threads to run.
To execute the script with the same 250 threads that I used, issue this command.
Test performance analysis
Running both workloads against my instances takes a little time to complete. I can still access each instance and run queries while the data is being added. Notably, my instance with the IO1 volume completed a little bit faster than the instance with the GP2 volume.
I can see the rate of inserts because the script emits messages for each thread at every commit interval to output.log. I include a timestamp in the data that I was inserting so that I can track and query the rate of inserts and the start and end times. I note from the table and the log that the last insert was completed on myinstance-GP2 roughly 20 minutes after it completed on myinstance-IO1.
| max timestamp | |
| GP2 | 2018-04-19 03:20:32 |
| IO1 | 2018-04-19 02:58:27 |
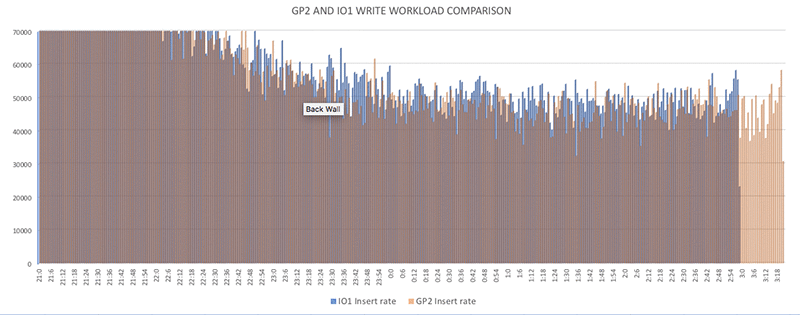
Let’s look a little closer at the details of the insert patterns for my instance. If I break apart the insert timestamp field and group by hour and minute, I can get a count of the number of inserts that occurred during each minute.
Looking closely at one or two of the insert timings, I can see that I’m getting a few more rows inserted each minute on the IO1 instance. The results and graphs from my testing are included for your review in the repository link preceding.
| Time in hour:minute | GP2 Insert rate | IO1 Insert rate | Difference |
| 21:32 | 99,462 | 131,403 | 31,941 |
| 21:33 | 111,114 | 125,956 | 14,842 |
| 21:34 | 109,431 | 121,396 | 11,965 |
The improved timing is related to an increased number of inserts that myinstance-IO1 achieved. The workloads were launched simultaneously and the initial burst of inserts between the two systems were comparable. For my test duration, for roughly 60 percent of the time, the pace of inserts on myinstance-IO1 is higher than the inserts on myinstance-GP2. The number varies between 100 rows and 32,000 rows each minute.
Look deeper with CloudWatch
Let’s use Amazon CloudWatch to look a little deeper into what was happening on my instances during the workload period. CloudWatch is a monitoring service for AWS Cloud resources and the applications you run on AWS. You can use Amazon CloudWatch to collect and track metrics, collect and monitor log files, set alarms, and automatically react to changes in your AWS resources.
I viewed my CloudWatch metrics in the RDS dashboard while I was running my workload. I was pleased to note that I wasn’t CPU constrained for this workload.
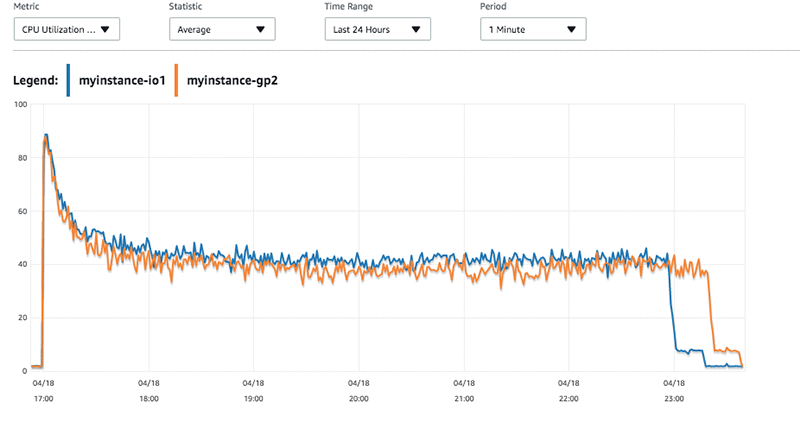
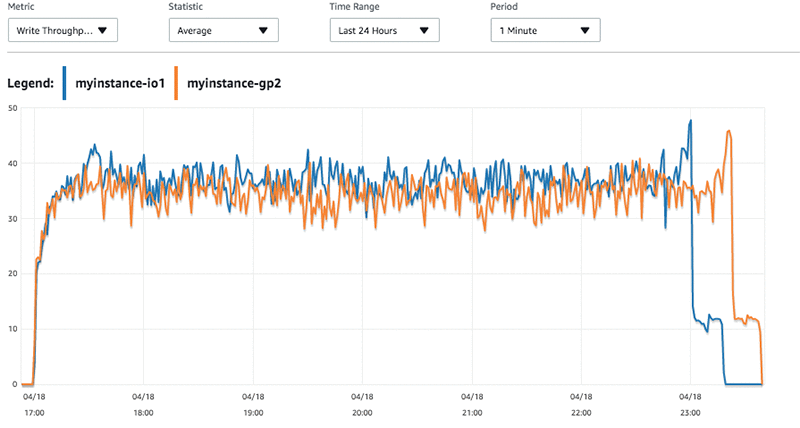
I can see that the myinstance-IO1 machine was writing at a faster rate than the myinstance-GP2 instance.
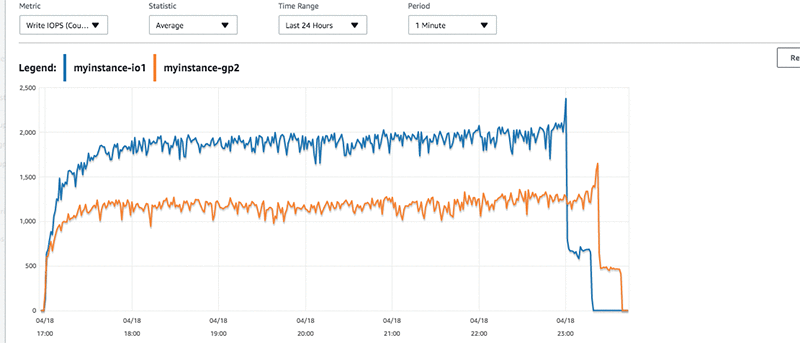
The myinstance-IO1 is delivering just below 2,500 provisioned IOPS at peak. The instance myinstance-GP2 stays steady at around 1200 IOPS base with a few peaks. This lower rate of IOPS for an identical workload, translates to a slightly higher latency for the transactions. The slight latency is reflected in the CloudWatch graphs.
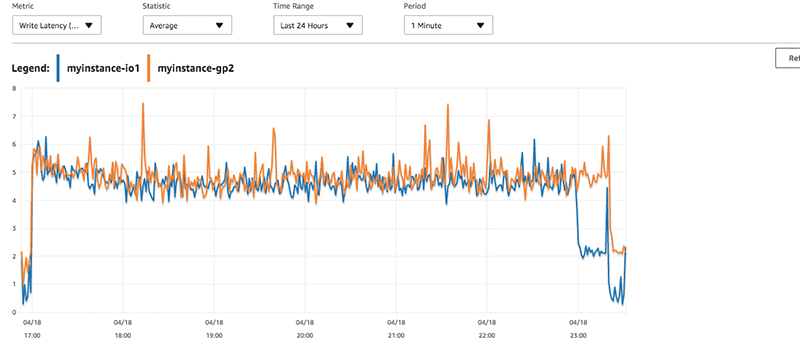
Tracking back to the number of inserts that we measured earlier, the latency present in the workload for myinstance-GP2 has a few more peaks in it. If I look at the write throughput, I see higher throughput from myinstance-IO1 than myinstance-GP2.
RDS instances that have GP2 volumes attached track the burst balance associated with the instances. In looking at the burst balance associated with myinstance-GP2 in CloudWatch, I can see that the balance is depleted during the initial workload period. My GP2 instance must then rely on base IOPS.
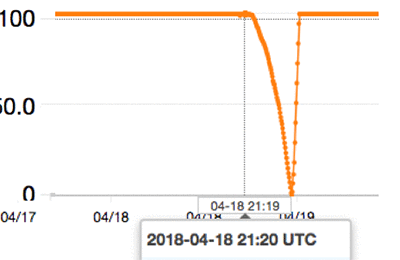
Note: The burst balance graph is shown from CloudWatch in UTC time, which is offset +4 hours from my browser’s time shown in the RDS graphs.
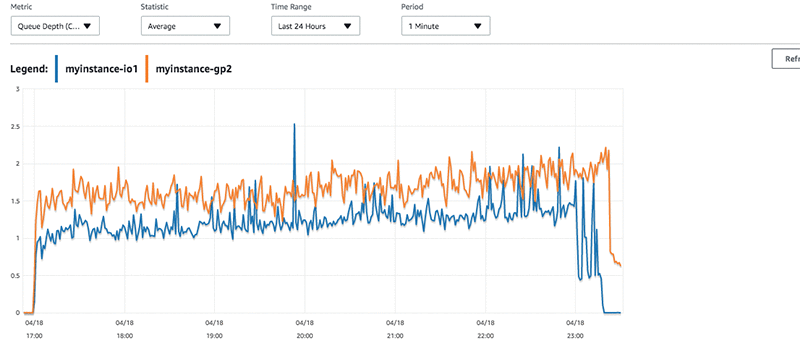
One other metric can help you understand how much work your instance is being asked to do. Disk Queue Depth is the number of I/O requests that are queued at a time against the storage. Each I/O request from the host to the storage consumes a queue entry.
Suppose that I examine the queue depth for my instances with my short burst, high volume, and concurrent writes. If I do, I can see that the queue depth remains consistent and that more writes are queued for the GP2 volume than for the IO1 volume during my test. You can read more about queue depth and other Amazon EBS performance topics in the AWS documentation.
Cost for the solution
Provisioned IOPS volumes cost more than GP2 volumes. At press time, the monthly cost for 400 gigabytes of GP2 storage in us-west-2 is $40 per month. The price to provision 5,000 IOPS for the same 400 gigabytes is higher at $375 per month.
If you choose to use Provisioned IOPS volumes for your instance, choose a value that meets your workload needs. If you start conservatively, you can increase the value as needed. If you increase only when you need to, you ensure that you’re not incurring unnecessary costs by overprovisioning. You can read more about elastic volumes in AWS, which make it easy to expand storage and adjust performance while the volume is in use.

I am overprovisioned for my workload. If this were mission-critical and more than a test case, I might choose provisioned IOPS but reduce to a lower value that matches my peak usage. With peak usage at 2500 IOPS, I can reduce the volume cost to $212.50/month. I need to provision to my peak usage, because PIOPS volumes are not burstable. They are designed to give consistent performance at the level you provision 99.9 percent of the time.

My example application is pretty small and the IOPS required are within range for GP2 volumes. I can use GP2 volumes to deliver a consistent baseline performance of 3 IOPS/GB by increasing the volume size. GP2 is designed to deliver the provisioned performance 99 percent of the time. For my database workload, I might provision 850–900 GB of GP2 storage, which would cost me $90/month and achieve 2500 IOPS 99 percent of the time. Increasing the size of the GP2 volumes scales up the IOPS so increasing your GP2 volumes to 3.34 TiB gives the volume a minimum performance of 10,000 IOPS.
If my system were critical and I needed guaranteed higher IO performance from it, I could choose provisioned I/O. However, a more cost-effective choice might be to provision a larger GP2 volume. When the guaranteed IOPS need of my application grows beyond 10,000 IOPS, then I might need to use provisioned IOPS. I can use the CloudWatch metrics covered in this blog post to understand when I need to make a change.
In the fictitious test scenario that I constructed, I showed how my workload (consistent writes) benefited from higher IOPS. With your application, the profile is likely different, the clues more subtle, and you might not have the luxury of provisioning a secondary instance for comparison. You have to evaluate the CloudWatch metrics for your database and look closely at how it is performing to decide if your workload benefits from higher IOPS.
Case study
I recently had a customer who experienced sudden, profound slowdowns in their application without much increase in CPU or connection activity. The application had been performing well until the recent slowdowns, with a consistent number of users connected.

Their RDS dashboards showed that they experienced read spikes that corresponded to the slowdown in the application and a mild uptick in their CPU.

When they examined the CloudWatch statistics for their GP2 instance, they saw that they were depleting their burst balance corresponding to an increase in read and write latency.

The customer tracked the activity back to some business-critical reporting that took place during the spike. To sustain both the report activity without a corresponding slowdown for the application users, we provisioned enough IOPS for the workload.
As a benefit to the additional IOPS, the end users also reported improved overall response times in the application as the read and write latency dropped. If the customer had set a CloudWatch alarm to notify them when their Burst Bucket balance was depleted, they would have seen the problem ahead of their users. Going forward, they set alarms on the remaining GP2 volume RDS instances when the balance dipped below 50 percent for two periods.
Your workload will vary from my tests and the case study. However, with insights from CloudWatch metrics you can set alerts and notifications to help you figure out when you might experience problems like insufficient IOPS. The right set of metrics and notifications can help you decide which volumes are right for you. You can evaluate the workload characteristics and decide whether GP2 volumes with base and burst IOPS are sufficient. Or it might be that your workload needs provisioned IOPS to deliver sustained performance to your users.
About the Author
 Wendy Neu has worked as a Data Architect with Amazon since January 2015. Prior to joining Amazon, she worked as a consultant in Cincinnati, OH helping customers integrate and manage their data from different unrelated data sources.