Containers
Introducing the new Amazon EKS console
Since its launch at re:Invent 2017, Amazon Elastic Kubernetes Service (EKS) has rapidly evolved to meet the needs of production Kubernetes users. Customers such as Intel, Snap, Intuit, GoDaddy, and Autodesk trust Amazon EKS to run their most sensitive and mission critical applications because of its security, reliability, and scalability.
One thing missing from Amazon EKS has been a simple way to easily visualize the configuration of your Kubernetes applications and API resources. Identifying and investigating issues required you to manually track across Kubernetes and AWS. All of this work meant it took longer to get up and running with Amazon EKS, especially if you were a new user.
Today, we’re excited to share the new Amazon EKS console. Now, Amazon EKS gives you a single place to see the status of your Kubernetes clusters, applications, and associated cloud resources. The console puts Kubernetes at your fingertips, making it easy to understand all the different components and dependencies of your application and check they are properly deployed.
A deeper look at your Kubernetes clusters
Because the EKS console is hosted on AWS, there’s nothing extra to setup or configure. Simply open up the console and select your cluster.
On the Overview tab, the first thing you’ll notice is a list of your cluster nodes. These nodes are the compute resources that power your Kubernetes applications, from the perspective of the Kubernetes control plane. Clicking into a node will show everything that the Kubernetes API server knows about this node, plus a little bit more. You can quickly explore different nodes and find links into related EKS managed node groups and the EC2 instance that the node represents. Being able to quickly navigate from Kubernetes to AWS in the console helps troubleshoot issues and can give you a rapid understanding of what’s happening on your cluster. An interesting fact; when using Fargate each pod you run appears as a node within your cluster due to Fargate running a unique Kubernetes node agent to support the pod.
The next tab over is Workloads. A workload is an application running on Kubernetes. This tab shows the applications running on your cluster. By default, all workloads are shown, but you can filter by namespace or workload type to find what you’re looking for quickly.
Note that you’ll only see workloads and namespaces that you have RBAC permissions to access. You can use the dropdown selector to quickly filter workloads by namespace, giving you a more focused view of cluster workloads.
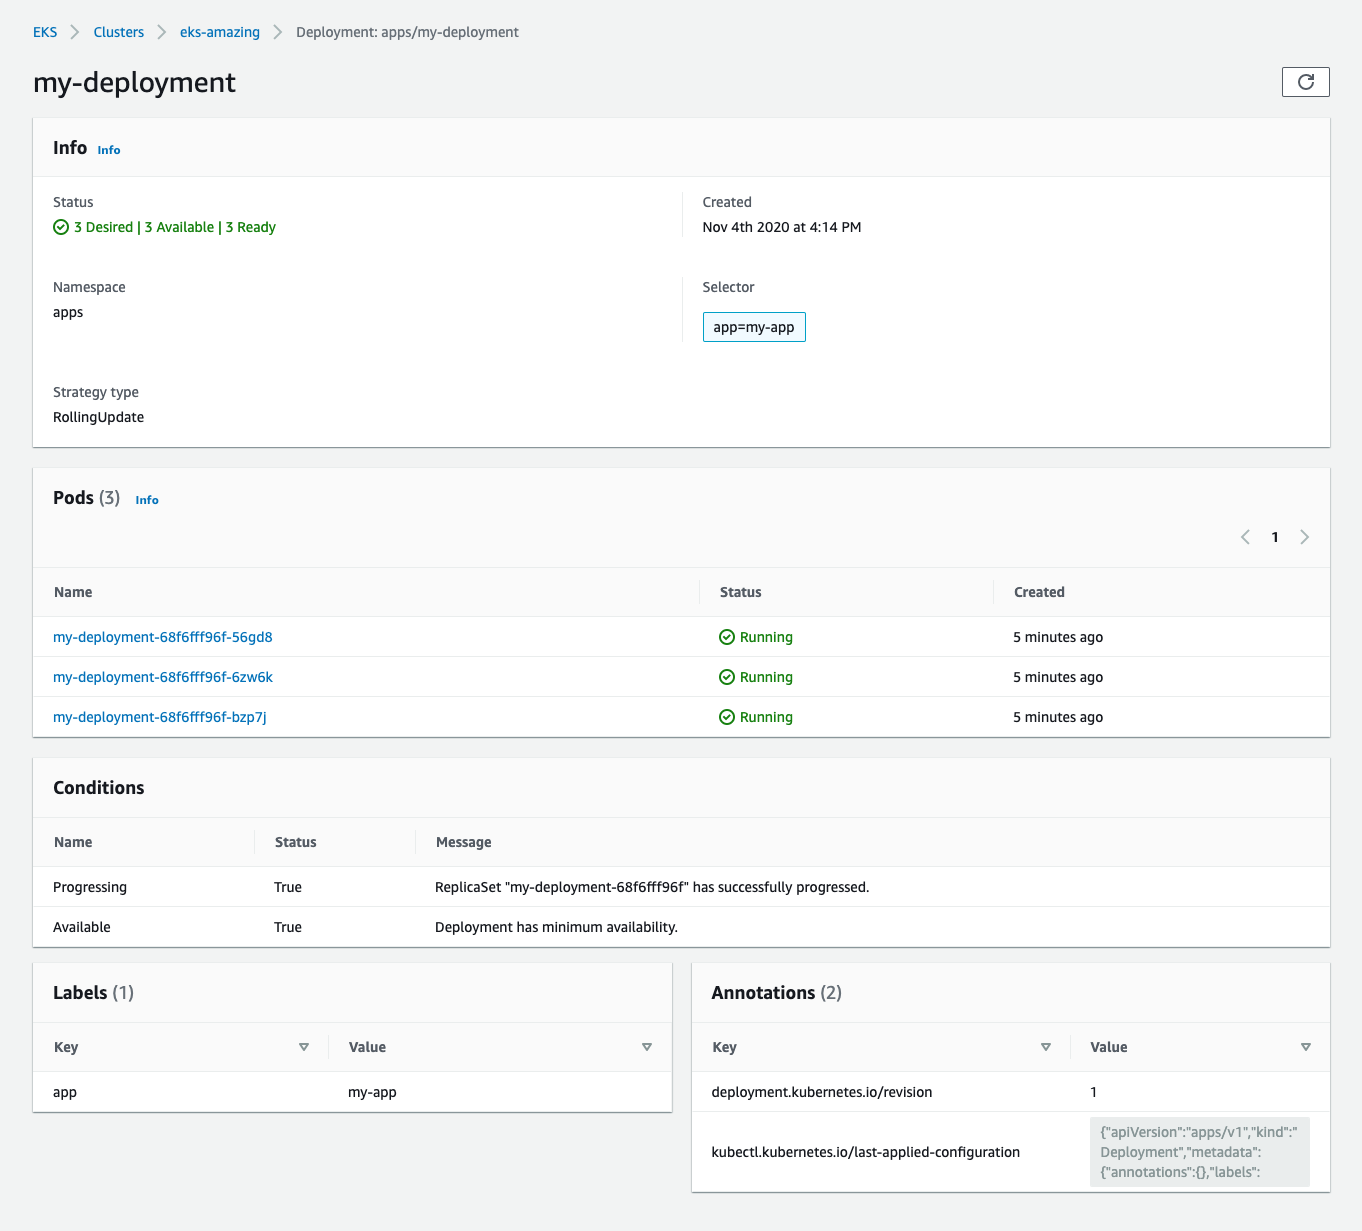
In Kubernetes, each workload defines one or more pods that run on your cluster. A pod defines one or more containers that run together. Clicking into one of our workloads – here aptly named my-deployment – you can see details about this deployment workload and the pods that are running to support it.
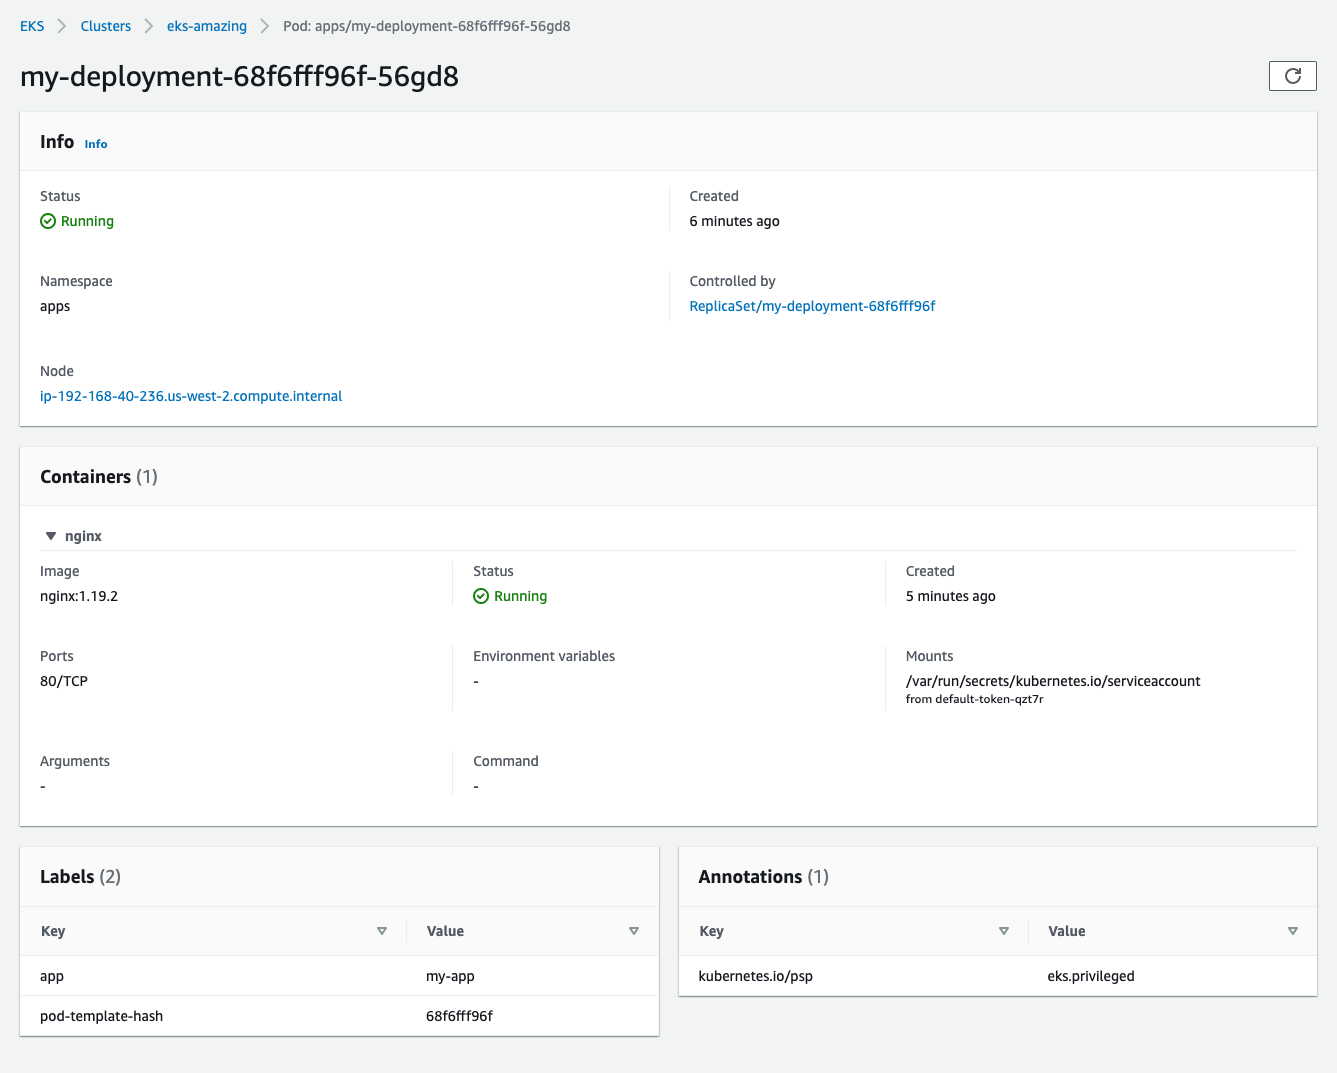
From here, you can go a step deeper, clicking into an individual pod to see its definition and status. You can look into each of the pod’s containers to view status and details, such as the image they are using, volume mounts, and other configuration details. This is useful to troubleshoot failures and check if changes are implemented.
A neat feature here is the deep link back to the node that this pod is running on. You can use this to see where pods are landing or to get a better understanding if issues with a particular node are causing problems for your applications. Providing in-context views like this is a key goal of this new console, offering a more unified, better-integrated experience that brings Kubernetes and AWS closer together.
In pods with multiple containers, you can easily inspect all of the containers within. The pod’s containers are expandable, showing details that allow you to quickly view the state and configuration of each one. Here we are looking at the Amazon Elastic Block Store (EBS) CSI driver, which helps you provision manage EBS volumes for the cluster.
All of the cluster management controls are still here, now tucked under the Configuration tab. This view holds all of the cluster’s configuration information, controls for compute and logging. A new addition here is the Add-ons tab, providing status and configuration of EKS add-ons.

Built-in security
Strong security controls are a critical part of running Kubernetes, and the new EKS console is no exception. Access to the Kubernetes API using the console can be controlled via tags and is logged in AWS CloudTrail. You can use RBAC on the cluster to give users access to specific namespaces or other resources, and these permissions will reflect in the console as each user only has permissions to see cluster resources based upon their IAM Role’s RBAC mapping within the cluster’s Auth ConfigMap. This provides an expected and intuitive experience, extending from existing best-practices for cluster access.
A hub for Kubernetes on AWS
The new EKS console helps bring Kubernetes and AWS closer together. Over the next year we have big plans for the EKS console, including adding support for displaying detailed configuration information for each Kubernetes resource on a cluster, making it even easier to cross-link between Kubernetes and AWS, bringing relevant metrics and tooling directly into context with your resources and applications, and surfacing insights from across your applications and clusters.
We also plan to allow you to visualize any Kubernetes cluster, no matter where or how it is running. Today the EKS console supports EKS clusters in the cloud. As part of EKS Anywhere, you’ll be able to easily connect your clusters running on-premises to EKS, providing consistent and on-demand insights into your applications and infrastructure.
Available Now
The new EKS console is available for every new and existing EKS cluster starting today. To get started, head over to the EKS console and create or click into any cluster. For more detailed information and instructions, see the EKS documentation.
-Nate & Jesse


