AWS Architecture Blog
Field Notes: Tracking Overall Equipment Effectiveness with AWS IoT Analytics and Amazon QuickSight
This post was co-authored with Michael Brown, Senior Solutions Architect, Manufacturing at AWS.
Overall equipment effectiveness (OEE) is a measure of how well a manufacturing operation is utilized (facilities, time and material) compared to its full potential, during the periods when it is scheduled to run. Measuring OEE provides a way to obtain actionable insights into manufacturing processes to increase the overall productivity along with reduction in waste.
In order to drive process efficiencies and optimize costs, manufacturing organizations need a scalable approach to accessing data across disparate silos across their organization. In this blog post, we will demonstrate how OEE can be calculated, monitored, and scaled out using two key services: AWS IoT Analytics and Amazon QuickSight.
Overview of solution
We will use the standard OEE formulas for this example:
| Availability = Actual Time / Planned Time (in minutes) |
| Performance = (Total Units/Actual Time) / Ideal Run Rate |
| Quality = Good Units Produced / Total Units Produced |
| OEE = Availability * Performance * Quality |
To calculate OEE, identify the following data for the calculation and its source:
| Supporting Data | Method of Ingest |
| Total Planned Scheduled Production Time | Manufacturing Execution Systems (MES) |
| Ideal Production Rate of Machine in Units | MES |
| Total Production for the Scheduled time | Programmable Logic Controller (PLC), MES |
| Total Number of Off-Quality units produced | PLC, Quality DB |
| Total Unplanned Downtime in minutes | PLC |
For the purpose of this exercise, we assume that the supporting data is ingested as an MQTT message.
As indicated in Figure 1, the data is ingested into AWS IoT Core and then sent to AWS IoT Analytics by an IoT rule to calculate the OEE metrics. These IoT data insights can then be viewed from a QuickSight dashboard. Specific machine states, like machine idling, could be notified to the technicians through email or SMS by Amazon Simple Notification Service (Amazon SNS). All OEE metrics can then be republished to AWS IoT Core so any other processes can consume them.
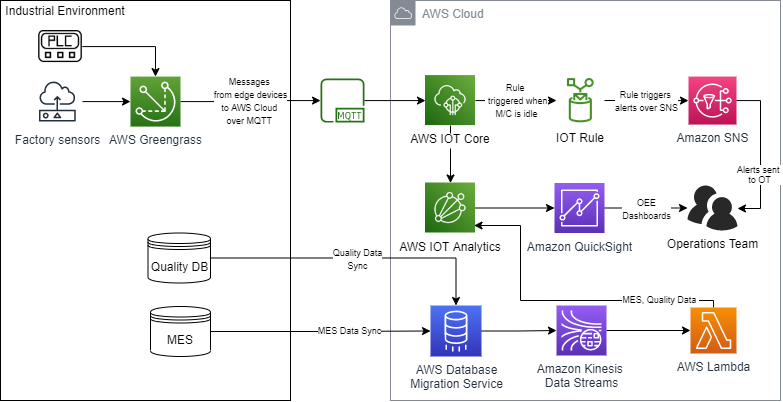
Figure 1. Tracking OEE using PLCs with AWS IoT Analytics and QuickSight
Walkthrough
The components of this solution are:
- PLC – An industrial computer that has been ruggedized and adapted for the control of manufacturing processes, such as assembly lines, robotic devices, or any activity that requires high reliability, ease of programming, and process fault diagnosis.
- AWS IoT Greengrass – Provides a secure way to seamlessly connect your edge devices to any AWS service and to third-party services.
- AWS IoT Core – Subscribes to the IoT topics and ingests data into the AWS Cloud for analysis.
- AWS IoT rule – Rules give your devices the ability to interact with AWS services. Rules are analyzed and actions are performed based on the MQTT topic stream.
- Amazon SNS – Sends notifications to the operations team when the machine downtime is greater than the rule threshold.
- AWS IoT Analytics – Filters, transforms, and enriches IoT data before storing it in a time-series data store for analysis. You can set up the service to collect only the data you need from your PLC and sensors and apply mathematical transforms to process the data.
- QuickSight – Helps you to visualize the OEE data across multiple shifts from AWS IoT Analytics.
- Amazon Kinesis Data Streams – Enables you to build custom applications that process and analyze streaming data for specialized needs.
- AWS Lambda – Lets you run code without provisioning or managing servers. In this example, it gets the JSON data records from Kinesis Data Streams and passes it to AWS IOT Analytics.
- AWS Database Migration Service (AWS DMS) – Helps migrate your databases to AWS with nearly no downtime. All data changes to the source database (MES, Quality Databases) that occur during the data sync are continuously replicated to the target, allowing the source database to be fully operational during the migration process.
Follow these steps to build an AWS infrastructure to track OEE:
- Collect data from the factory floor using PLCs and sensors.
Here is a sample of the JSON data which will be ingested into AWS IoT Core.
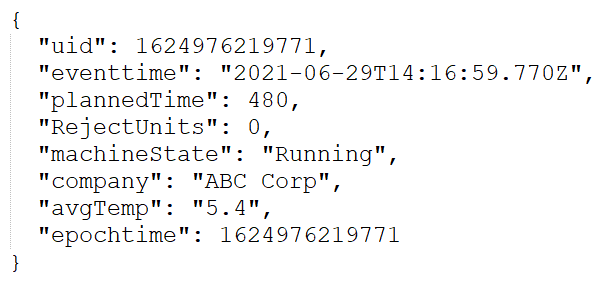
In AWS IoT Analytics, a data store needs to be created which is needed to query and gather insights for OEE calculation. Refer to Getting started with AWS IoT Analytics to create a channel, pipeline, and data store. Note that AWS IoT Analytics receives data from the factory sensors and PLCs, as well as through Kinesis Data Streams from AWS DMS. In this blog post, we focus on how the data from AWS IoT Analytics is integrated with QuickSight to calculate OEE.
- Create a dataset in AWS IoT Analytics.In this example, one of our targets is to determine the total number of good units produced per shift to calculate the OEE over a one-day time period across shifts. For this purpose, only the necessary data is stored in AWS IoT Analytics as datasets and partitioned for performant analysis. Because the ingested data includes data across all machine states, we want to selectively collect data only when the machine is in a running state. AWS IoT Analytics helps to gather this specific data through SQL queries as shown in Figure 2.
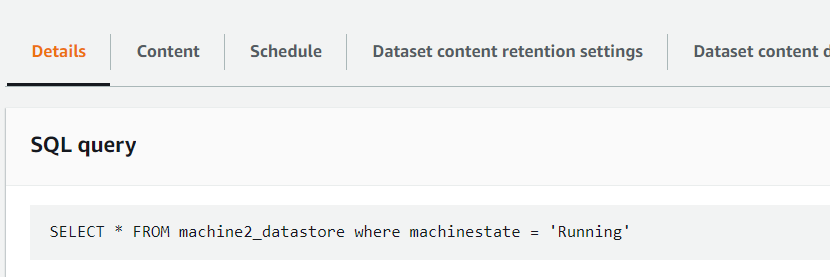
Figure 2. SQL query in IoT Analytics to create a dataset
Cron expressions are expressions that indicate a schedule such that the tasks can be run automatically based on a schedule and frequency. AWS IoT Analytics provides options to query for the datasets at a frequency based on cron expressions.
Because we want to produce daily reports in QuickSight, set the Cron expression as shown in Figure 3.

Figure 3. Cron expression to query data daily
- Create an Amazon QuickSight dashboard to analyze the AWS IOT Analytics data.
To connect the AWS IoT Analytics dataset in this example to QuickSight, follow the steps contained in Visualizing AWS IoT Analytics data. After you have created a dataset under QuickSight, you can add calculated fields (Figure 4) as needed. We are creating the following fields to enable the dashboard to show the sum of units produced across shifts.
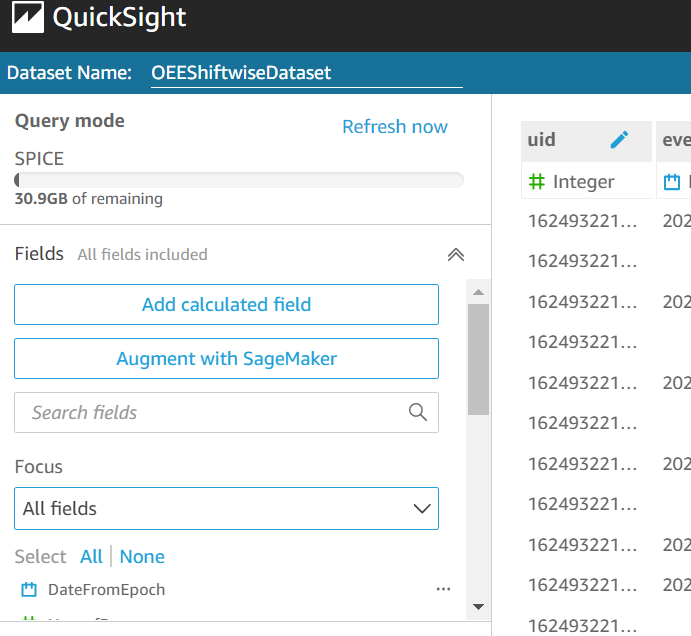
Figure 4. Adding calculated fields in Amazon QuickSight
We first add a calculated field as DateFromEpoch to produce a date from the ‘epochtime’ key of the JSON as shown in Figure 5.
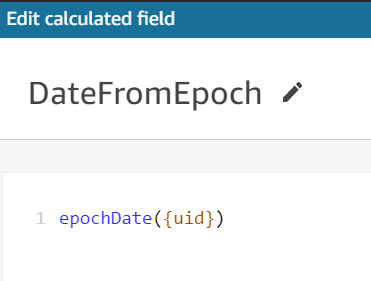
Figure 5. DateFromEpoch calculated field
Similarly, you can create the following fields using the built-in functions available in QuickSight dataset as shown in Figures 6, 7, and 8.
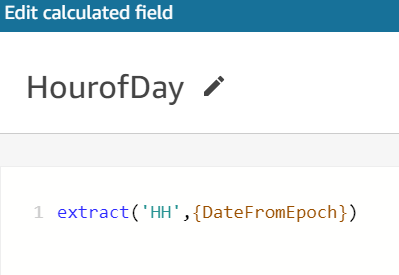
Figure 6. HourofDay calculated field

Figure 7. ShiftNumber calculated field

Figure 8. ShiftSegregator calculated field
To determine the total number of good units produced, use the formula shown in Figure 9.
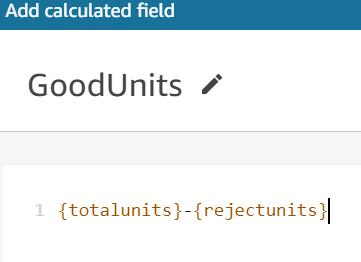
Figure 9. Formula for total number of good units produced
After the fields are calculated, save the dataset and create a new analysis with this dataset. Choose the stacked bar combo chart and add the dimensions and measures from Figure 10 to produce the visualization. This analysis shows the sum of good units produced across shifts using the calculated field GoodUnits.
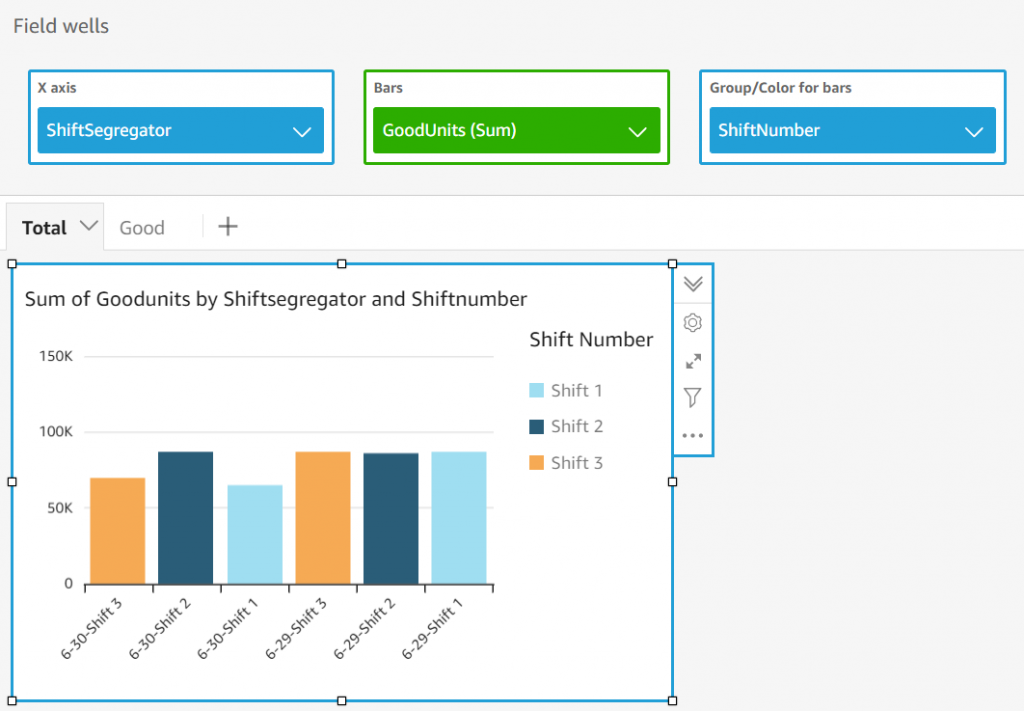
Figure 10. Good units across shifts on Amazon QuickSight dashboard
- Calculate OEE.To calculate OEE across shifts, we need to determine the values stated in Table 1. For the sake of simplicity, determine the OEE for Shift 1 and Shift 2 on 6/30.
Let us introduce the calculated field ShiftQuality as in Figure 11.
-
- Calculate Quality
Good Units Produced / Total Units Produced
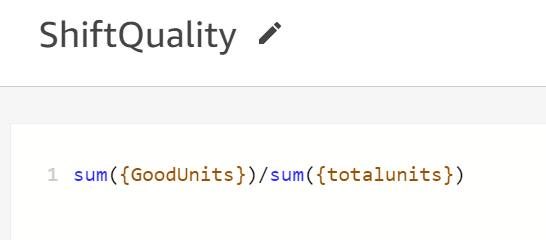
Figure 11. Quality calculation
Add a filter to include only Shift 1 and 2 on 6/30. Change the Range value for the bar to be from .90 to .95 to see the differences in Quality across shifts as in Figure 12.
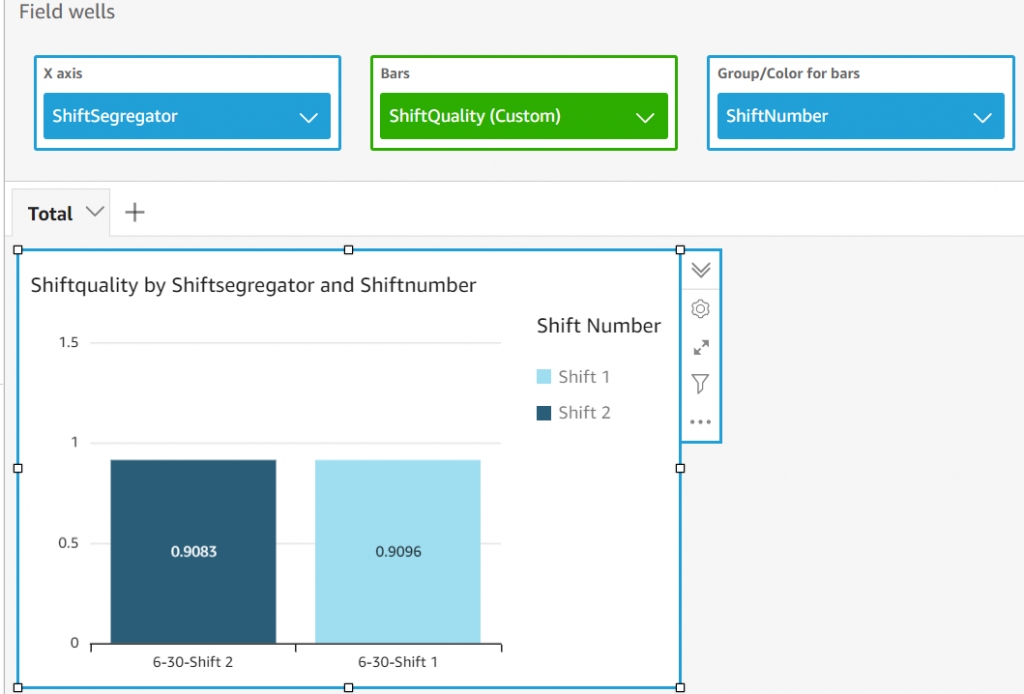
Figure 12. Quality differences across shifts
-
- Calculate Performance
(Total Units/Actual Time) / Ideal Run Rate
For this factory, we know the Ideal Production Rate is 203 units per minute per shift (100,000 units/480 minutes). We already know the actual run time for each shift by excluding the idle and stopped state times. We add a calculated field for ShiftPerformance using the previous formula. Change the range of the bar in the visual to be able to see the differences in performances across the shifts as in Figure 13.
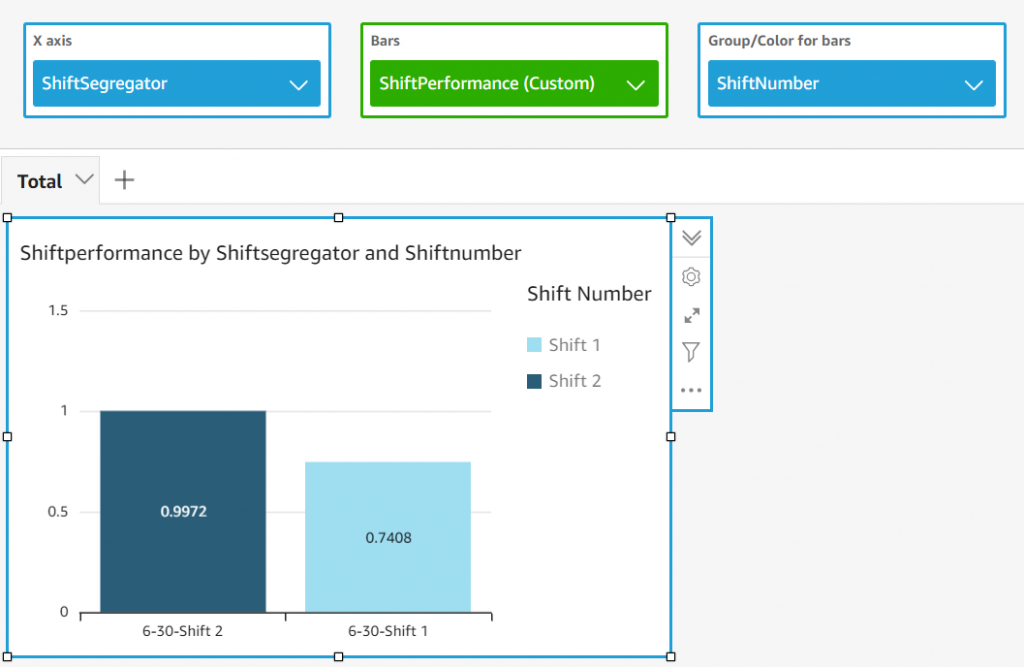
Figure 13. Performance calculation
-
- Calculate Availability
Actual Time / Planned Time (in minutes)
The planned time for a shift is 480 minutes. Add a calculated field using the previous formula.
-
- Calculate OEE
OEE = Performance * Availability * Quality
Finally, add a calculated field for ShiftOEE as in Figure 14. Include this field as the Bar to be able to see the OEE differences across shifts as in Figure 15.

Figure 14. OEE calculation
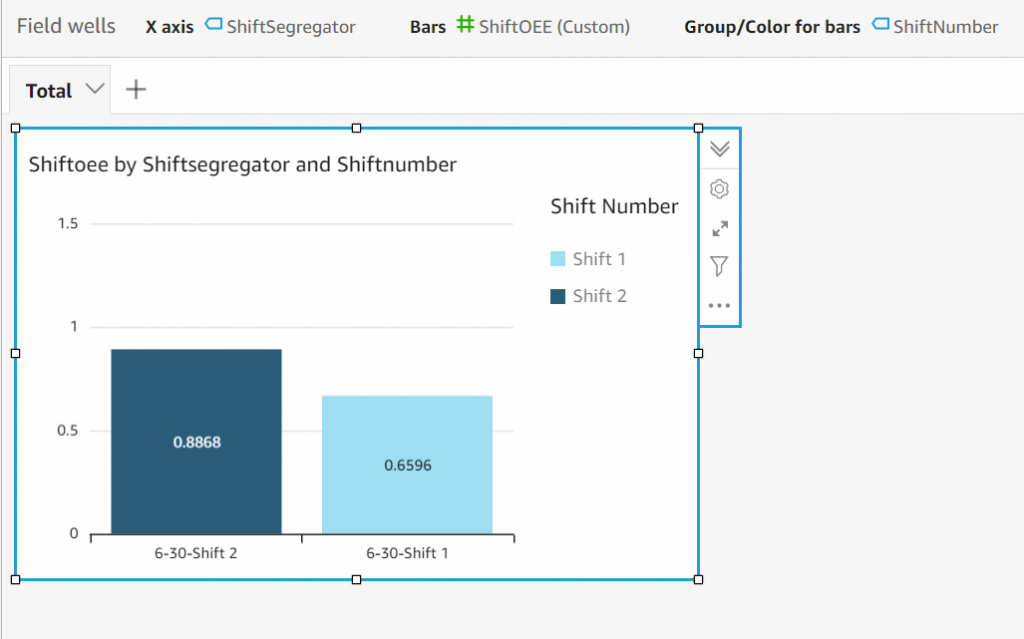
Figure 15. OEE across shifts
Shift 3 on 6/28 has the higher of the two OEEs compared in this example.
Note that you can schedule a dataset refresh in QuickSight for everyday as shown in Figure 16. This way you get to see the dataset and the visuals with the most recent data.
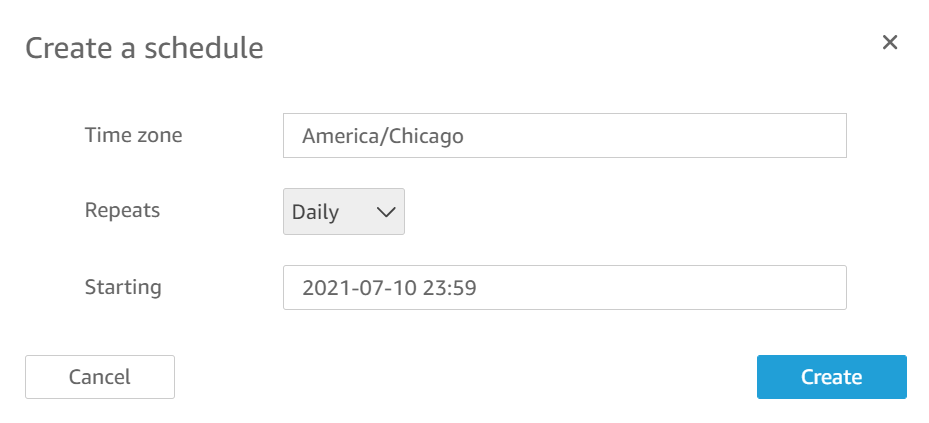
Figure 16. Dataset refresh schedule
All the above is a one-time setup to calculate OEE.
- Enable an AWS IoT rule to invoke Amazon SNS notifications when a machine is idle beyond the threshold time using AWS IoT rule.
You can create rules to invoke alerts over an Amazon SNS topic by adding an action under AWS IoT core as shown in Figures 17 and 18. In our example, we can invoke alerts to the factory operations team whenever a machine is in idle state. Refer to AWS IoT SQL reference for more information on creating rules through AWS IoT Core rule query statement.
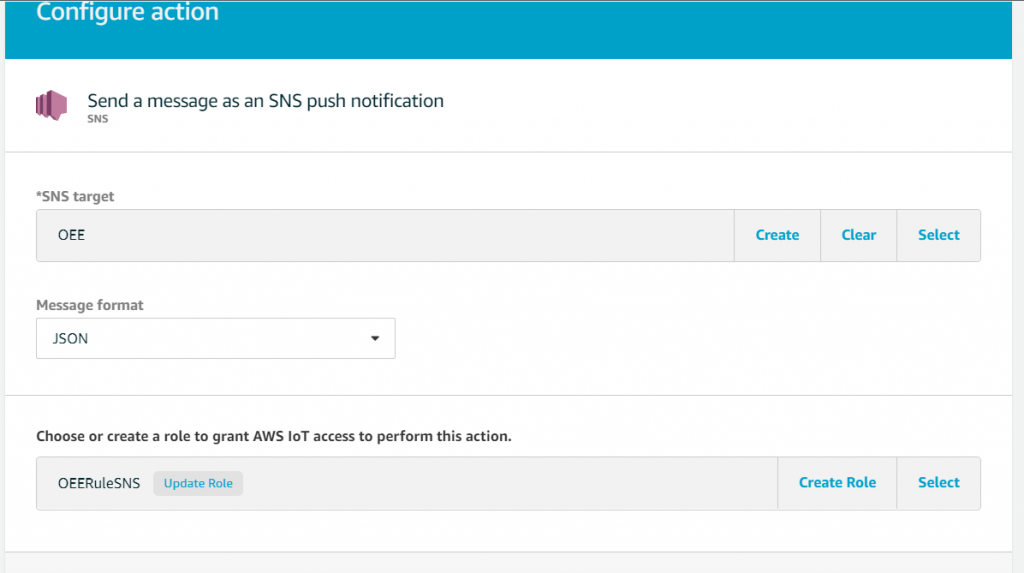
Figure 17. Send messages through SNS

Figure 18. Set up IoT rules
Conclusion
In this blog post, we showed you how to calculate the OEE on factory IoT data by using two AWS IoT services: AWS IoT Core and AWS IoT Analytics. We used the seamless integration of QuickSight with AWS IoT Analytics and also the calculated fields feature of QuickSight to run calculations on industry data with field level formulas.