AWS Partner Network (APN) Blog
Monitor Your Migration to AWS Graviton2-Powered Amazon EC2 Instances with Datadog
By Arthur Petitpierre, Sr. Specialist SA, EC2 ARM at AWS
By Jimmy Caputo, Product Manager at Datadog
 |
 |
 |
At re:Invent 2019, AWS announced six new Amazon Elastic Compute Cloud (Amazon EC2) instance types powered by the Arm-based AWS Graviton2 processor. They are the general purpose M6g, the compute-optimized C6g, the memory-optimized R6g, and their disk variants M6gd, C6gd, and R6gd with local NVMe-based SSD block-level storage.
These instance types offer up to 40 percent better price performance over comparable current generation x86-based instances. Amazon Web Services recently announced that M6g, C6g, and R6g instances are now generally available, so you can begin optimizing even more of your workloads in Amazon EC2.
If you’re thinking about shifting existing workloads to one of these new instances, Datadog can help you monitor your migration and gain insight into your entire AWS infrastructure.
The Datadog Agent—open-source software available on GitHub—collects infrastructure metrics, distributed traces, logs, and more from your Amazon EC2 instances (or other hosts).
Datadog is an AWS Partner Network (APN) Advanced Technology Partner with AWS Competencies in DevOps, Migration, Containers, and Microsoft Workloads.
In this post, we show you how to use Datadog to monitor your AWS Graviton2-based instances so you can compare performance, visualize instance data, and enable trace collection.
How to Compare Performance Between Instance Types
Graviton2-powered instance types like the general purpose M6g are designed to support a wide variety of workloads, including application servers, databases, microservices, in-memory caches, and more, with improved performance at a lower price.
To demonstrate how easy it is to visualize these performance improvements in Datadog, we ran a benchmark test for a simple Python application deployed behind Apache servers on two different instance types:
- Arm-based m6g.large instance (
hellobench-aarch64service in Figure 1) - x86-based m5.large instance (
hellobench-x86service in Figure 1)
Our benchmark application used the aiohttp library and was instrumented with Datadog Python tracing library. To run the test, we used Apache’s HTTP server benchmarking tool to generate a constant, equivalent stream of requests across the two instances.
You can view application benchmarks for both the hellobench-aarch64 and hellobench-x86 services in Datadog APM.
Figure 1 – Performance benchmarks for a Python application running on two instance types.
Notice the hellobench-arm64 service running on the new M6g instance served the same volume of requests with 71 percent of the x86 latency (17 ms vs. 24 ms).
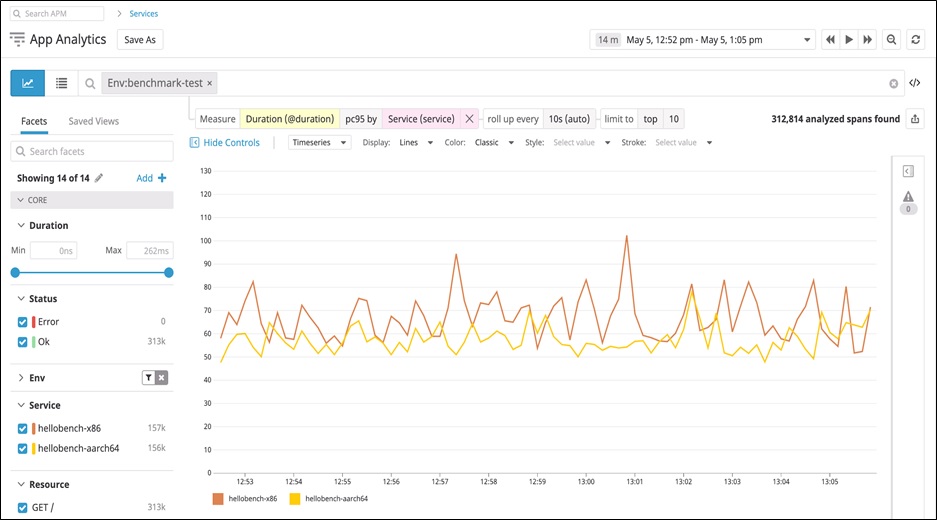
You can also use Datadog App Analytics to help visualize trace data across these services. The following graph compares p95 latency for both services.
Figure 2 – Using Datadog App Analytics to visualize trace data.
As you can see, the service running on the M6g instance (in yellow) experiences a 15 percent better p95 latency.
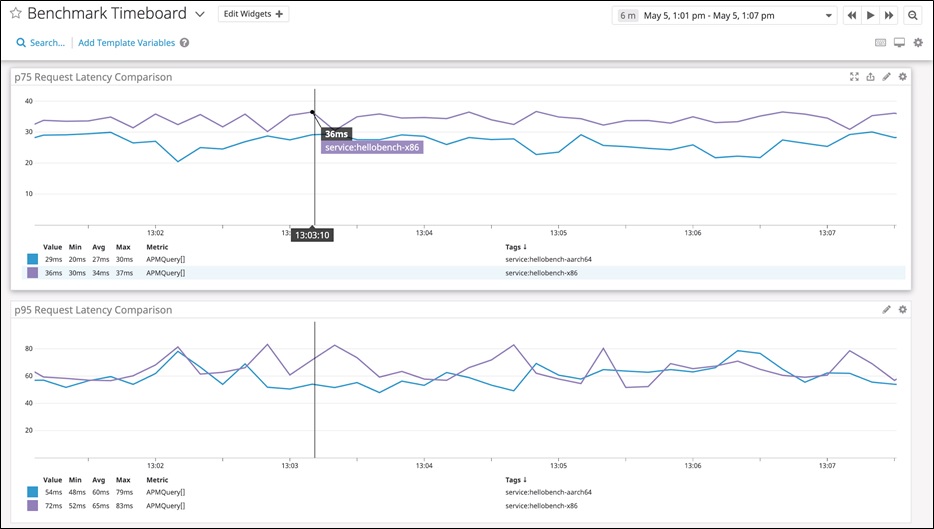
Once you create your visualization in App Analytics, you can export it to a dashboard and easily view multiple comparisons at once.
Figure 3 – Visualizing multiple latency comparisons on Datadog dashboard.
The preceding graphs compare p75 and p95 latencies for both instance types. You can also use the dashboard to compare data from the other metrics Datadog automatically collects, such as CPU usage and request volume. This enables you to see which instance is able to handle more requests and has more processing power.
Whether you are running application services on x86-based instance types or looking to migrate service workloads to a new Graviton2-powered instance, Datadog can help you monitor all of them and easily compare performance. Let us show you how to get started.
How to Deploy the Datadog Agent on Amazon EC2 Instances
The Datadog Agent is already compatible with the new instance types. You can deploy it with a single command directly to any Amazon EC2 instance, or you can deploy it automatically across all your instances using a configuration management tool such as AWS CloudFormation.
For example, you can use the following command to deploy the Agent to the general purpose M6g instance type running Amazon Linux 2:
The Datadog Agent needs an API key to send metrics and events to Datadog. You can find the API key in your Datadog account. Once you deploy the Agent, you have instant access to system-level metrics, and can easily visualize your infrastructure.
Ways to Visualize Instance Data
Installing the Agent on each of your Amazon EC2 instances provides several benefits, including the ability to collect additional metrics from more than one integration, and creating custom metrics for all your services.
The Agent automatically tags Amazon EC2 metrics with metadata such as region, availability-zone, instance-type, and image. You can use the tags to search and group in Datadog.
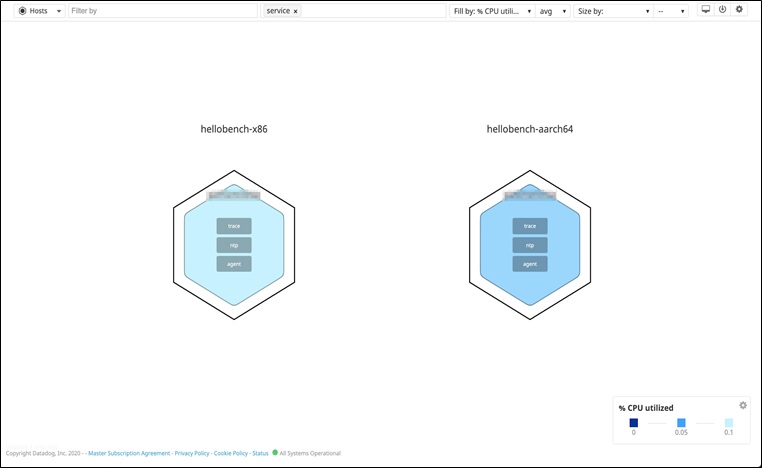
For instance, Datadog’s Host Map shows you data such as CPU utilization across your entire infrastructure, and organizes instances by tags. If you’re migrating workloads to new Graviton2-powered instance types, you can use tags to automatically group your infrastructure and compare utilization between each instance, as shown below.
Figure 4 – Visualizing CPU utilization between two different instances.
This enables you to monitor performance at the infrastructure level throughout the migration and calculate potential cost savings. New instances automatically appear in the host map as you spin them up and deploy the Agent, so you can seamlessly monitor infrastructure changes as they happen.
How to Enable Trace Collection for Better Visibility
Installing the Agent allows you to instrument your application and collect traces from services across Amazon EC2 instances, and monitor their performance from a Datadog dashboard.
To start collecting traces, first configure an environment in the Agent’s datadog.yaml configuration file. This tags all incoming traces so you can easily search for them in Datadog.
Datadog supports several libraries that auto-instrument applications written for a wide range of languages and frameworks such as Java, Python, Django, and Flask.
You can use the Datadog Service Map to visualize the traces coming from your instrumented application, track interdependencies, and quickly find bottlenecks between service workloads. The Agent can also capture processes and logs from the services hosted on your instances. They let you easily correlate data from technologies such as Apache with key Amazon EC2 metrics.
Conclusion
If you are thinking about shifting existing workloads to one of the new Amazon EC2 Graviton2-based instances, you can use the Datadog Agent to immediately begin collecting performance data. And with Datadog’s other AWS integrations, you can monitor even more of your AWS infrastructure and correlate that data with the data collected by the Agent.
Read about AWS Graviton2 based EC2 instances, and sign up for a Datadog trial if you don’t already have an account.
.
.
Datadog – APN Partner Spotlight
Datadog is an AWS Competency Partner. A monitoring service for cloud-scale applications, Datadog brings together data from servers, databases, tools, and services to present a unified view of your entire stack.
Contact Datadog | Solution Overview | AWS Marketplace
*Already worked with Datadog? Rate this Partner
*To review an APN Partner, you must be an AWS customer that has worked with them directly on a project.


