AWS Partner Network (APN) Blog
How Sumo Logic Ensures Reliability with AWS Lambda Observability
By Pawel Brzoska, Group Product Manager – Sumo Logic
By Dilip Rajan, Sr. Partner Solutions Architect – AWS
 |
| Sumo Logic |
 |
First thing in the morning when you get your breakfast, pour a cup of coffee, and fire up your social media apps, AWS Lambda’s serverless compute services are hard at work to power your applications.
Behind the scenes, new Lambda functions are responding to increased load from the morning rush and scale up quickly and automatically. There is a state change in your game app as you move from novice to pro which triggers a Lambda function to dispatch a confetti drone to your house.
Meanwhile, there’s an engineer trying to pull together the right telemetry for the Lambda functions to ensure reliability and a great customer experience.
The telemetry required for AWS Lambda observability is not the same as it was for the monoliths of the past, where CPU, memory, disc, and network metrics were indicators of application infrastructure performance.
Lambda observability requires a different and more integrated set of telemetry that gives a comprehensive picture of your functions. In addition, Lambda observability must reveal how functions perform while handling customer transactions and correlate that performance to the wide range of other AWS services that are a part of your application.
In this post, we discuss how AWS Lambda is used in practice and how Sumo Logic’s enables Lambda observability via its integration and scalable analytics capabilities.
Sumo Logic is an AWS Partner with AWS Competencies in Containers, Data and Analytics, DevOps, and Security, providing customers with a secure, cloud-native, machine data analytics service. Sumo Logic’s product is also AWS Lambda Ready, meaning it has been validated by AWS serverless experts against the AWS Well-Architected Framework.
Before we discuss Sumo Logic’s solution, let’s take a look at why observability is increasingly becoming a must have function for developers and IT professionals.
What is Observability?
AWS Lambda allows you to run your code without provisioning or managing servers. It runs on a high availability compute infrastructure that takes care of scaling so you can focus on your code.
Serverless technologies like Lambda are increasingly popular thanks to their lack of operational overhead and fine-grained cost control. They’re highly flexible, scale from zero to infinity, and enable customers to never pay for idle resources.
Achieving observability for these components, and integrating that telemetry into your broader observability strategy, can come with its fair share of challenges, however.
The reliability of your serverless applications is the foundation of great customer experiences. Sumo Logic’s AWS observability solution helps you understand how different datasets and services are connected, and shows those relationships via workflows that make it more intuitive for you to get a holistic view of your applications.
These workflows help maintain application reliability across three areas: monitoring, diagnosing, and troubleshooting.
- Monitoring answers the “What’s wrong?” question, which can come from logs, metrics, or traces.
- Diagnosing answers the “Where’s the issue?” question, which typically comes from logs or traces.
- Troubleshooting answers the all-important “Why is it broken and how do I fix it?” questions, which usually come from the source of truth such as logs.
Addressing these areas allows you to simplify monitoring and speed up diagnosing and troubleshooting. Let’s dive into how Sumo Logic is able to provide richer insights into AWS Lambda.
Sumo Logic Enables Rich Lambda Observability
There are two key requirements for any observability solution to enable efficient monitoring, diagnosing, and troubleshooting:
- Ingestion of logs, metrics, and traces
- Scalable analytics engine
Ingestion of Logs, Metrics, and Traces
Any observability solution should first and foremost be able to ingest and handle large-scale datasets for logs, metrics, and traces.
Sumo Logic seamlessly ingests your critical Lambda telemetry from Amazon CloudWatch, which helps monitor, diagnose, and troubleshoot your Lambda functions running in production.
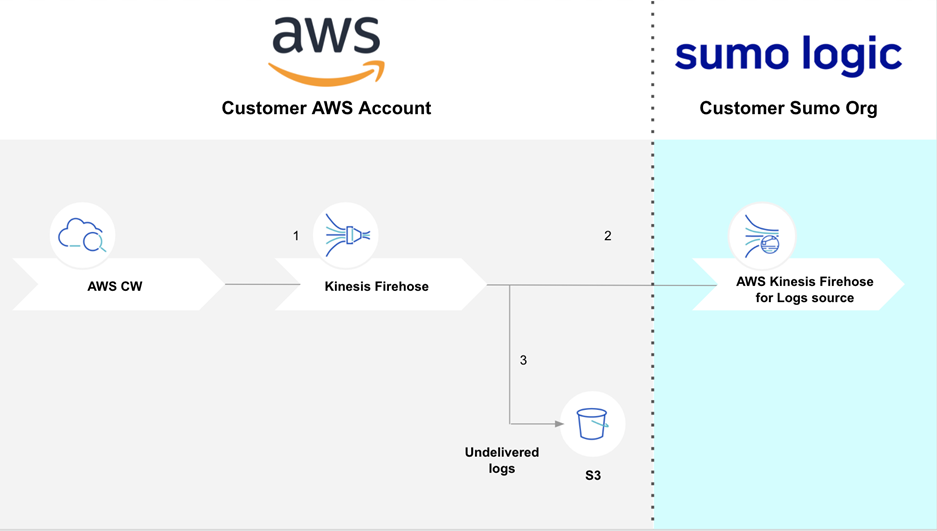
Figure 1 – Sumo Logic data ingestion architecture for CloudWatch logs.
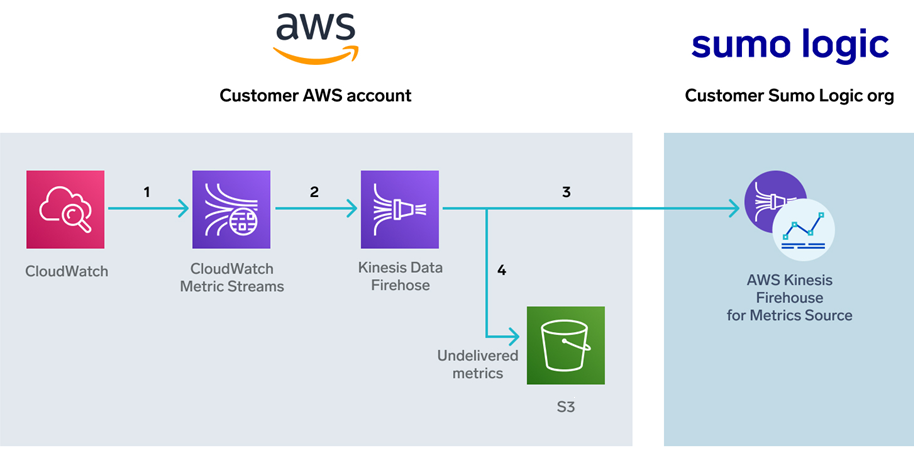
Here, Figure 1 and Figure 2 illustrate how Sumo Logic ingests the Lambda telemetry using CloudWatch and Amazon Kinesis Data Firehose for both logs and metrics. This can be setup and configured via AWS CloudFormation templates.
Figure 2 – Sumo Logic data ingestion architecture for CloudWatch metrics.
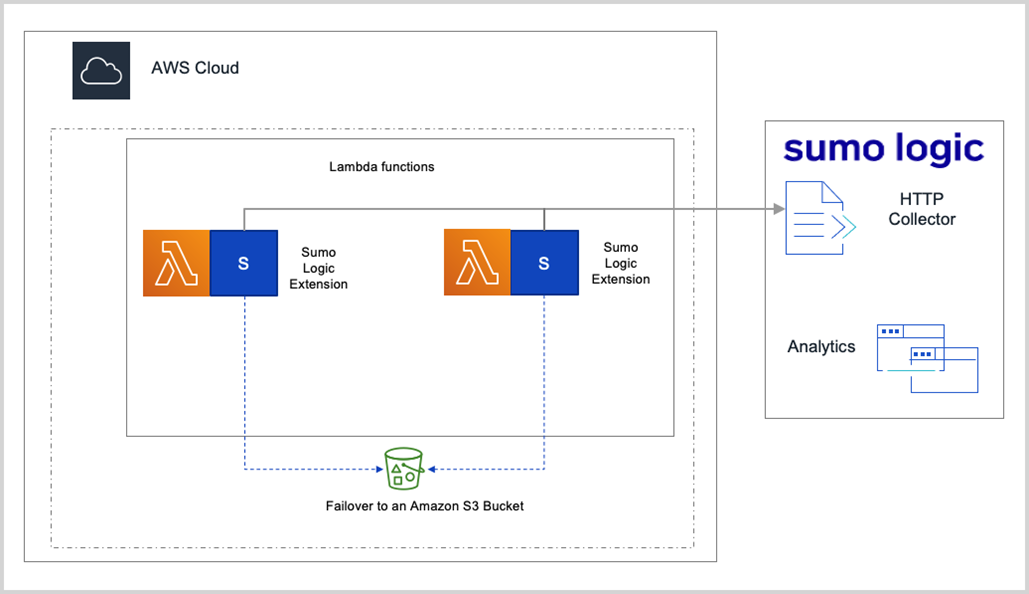
You can also use Sumo Logic’s Lambda extension to send platform, function, and extension logs to Sumo Logic which you can quickly identify and remediate errors and exceptions. Furthermore, with this data in Sumo Logic customers have the needed context to speed up root cause analysis.
Figure 3 – Sumo Logic data ingestion architecture.
Sumo Logic’s AWS observability solution can also bring in CloudWatch logs and metrics data for Lambda along with data for other key AWS services such as Amazon EC2, Amazon ECS, Amazon RDS, Amazon DynamoDB, Amazon API Gateway, Amazon ElastiCache, and Elastic Load Balancing.
The solution can be configured in minutes via CloudFormation templates or Terraform scripts.
Figure 4 – Data ingestion setup with AWS CloudFormation and Terraform.
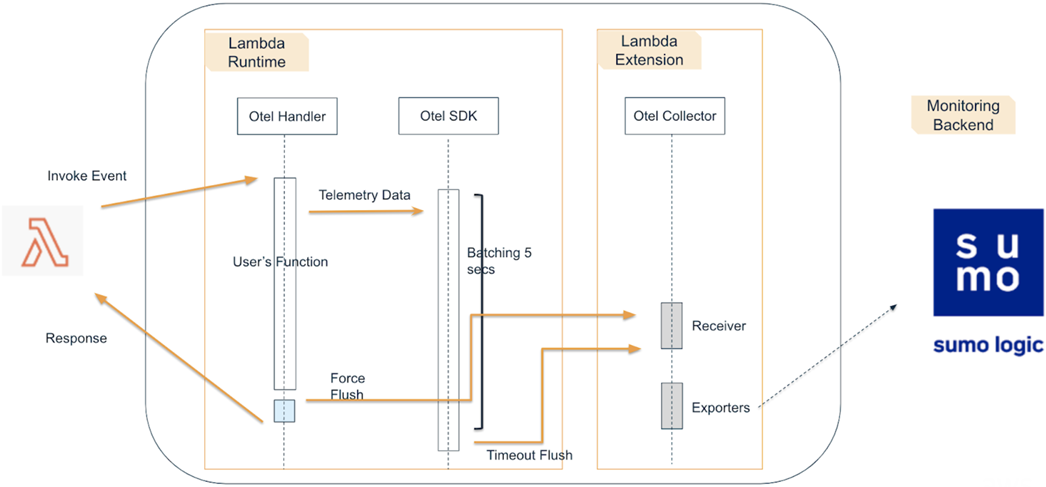
In addition to logs and metrics, Sumo Logic ingests Lambda tracing data via the AWS Distro for OpenTelemetry and supports Java, JS, Go, and Python programming languages.
Figure 5 – Ingestion of AWS Lambda data.
You might be wondering, “Well, I got all of those logs and metrics from Lambda and ingested them to Sumo Logic, but what do I do with them?” This is where Sumo Logic’s scalable analytics engine can help, so let’s take a look.
Scalable Analytics Engine
An observability solution also needs to have a highly scalable analytics engine, as it requires you to analyze large amounts of data for machine learning and other initiative search-driven analytics capabilities.
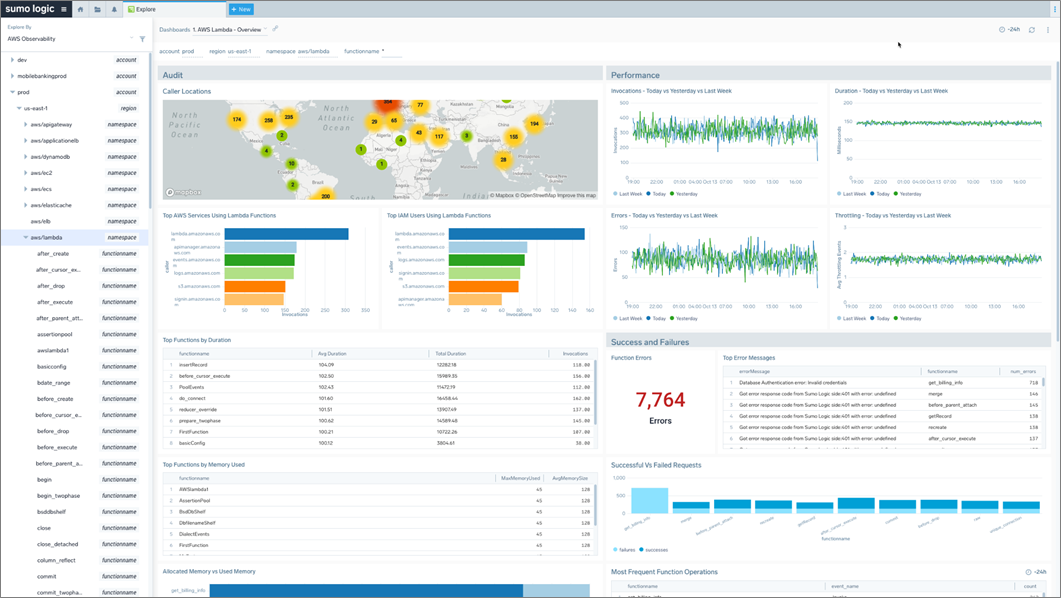
With data ingested, Sumo Logic provides comprehensive visibility into your complete AWS infrastructure. Out-of-the-box dashboards and alerts built specially for Lambda provide instant visibility into like invocations over time, function duration, throttling, successful vs. failed requests, error messages, resource utilization, and provisioned concurrency.
Figure 6 – Sumo Logic dashboard for Lambda observability.
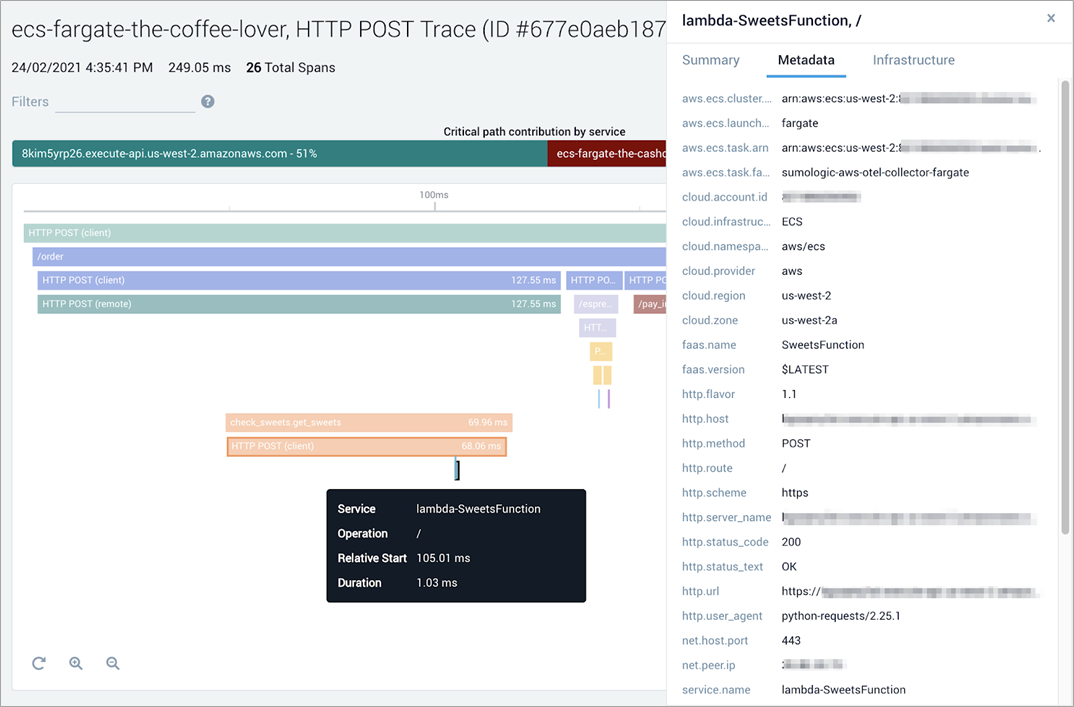
In addition, you can get end-to-end visibility of your transactions via Sumo Logic Tracing that include Lambda calls in both purely serverless or mixed environments.
Figure 7 – Sumo Logic dashboard with Lambda trace data.
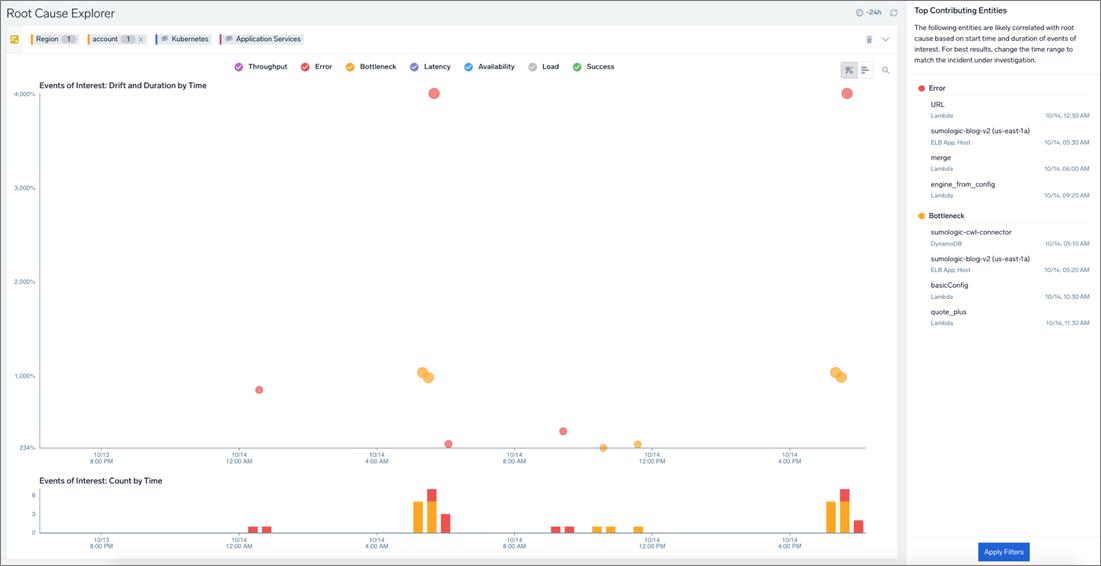
Sumo Logic’s Root Cause Explorer helps on-call staff, DevOps, and infrastructure engineers accelerate troubleshooting and root cause isolation for incidents in their apps and microservices running on AWS, including Lambda.
Figure 8 – Sumo Logic Root Cause Explorer.
Conclusion
Sumo Logic helps demystify AWS Lambda observability by streamlining telemetry ingestion, unifying data, and correlating insights across disparate services.
With the continued adoption of ephemeral technologies, an observability strategy that covers Lambda as well as other AWS services helps speed up issue resolution and improve overall reliability.
Logs, metrics, and tracing data is more powerful in a unified platform than siloed in individual tools. Get a free trial of Sumo Logic to try out the unified contextual observability solution in your application.
Sumo Logic – AWS Partner Spotlight
Sumo Logic is an AWS Competency Partner and leading cloud-based machine data analytics service that helps customers gain instant insights into their growing and complex pool of machine data.
Contact Sumo Logic | Partner Overview | AWS Marketplace
*Already worked with Sumo Logic? Rate the Partner
*To review an AWS Partner, you must be a customer that has worked with them directly on a project.
