人工知能 (AI) および機械学習 (ML) の分野は、ヘルスケア産業、特に医用画像化において、勢いを増しつつあります。ML に対する Amazon SageMaker のアプローチは、ヘルスケア分野において将来有望であると言えます。ML は、産業間全体のどの分野においても、適用可能であると考えられています。ヘルスケア分野の範囲で言えば、ML は最終診断を下すための重要な要素として、放射線検査または検査報告のような役割を果たすことが可能なのです。
このブログ投稿では、UCI ML Dataset を使用して、整形外科における ML の使用について説明し、脊椎の病状予測を自動化することを目指します。この技術は、診断時間を短縮し、ML を用いた拒絶選択肢技術を促すことによって、診察訪問数および / または処方数を最小限に抑える対策について考えるよい機会となるでしょう。 この技術により、難しい症例は整形外科医などの専門家に委ねられることになるでしょう。データセットの 2 つの診断である、椎間板ヘルニアおよび脊椎すべり症は、筋骨格疼痛障害を引き起こしうる脊髄病変の 1 つです。疼痛障害のためのオピオイド処方を最小限に抑えるため、リスクにさらされている患者を客観的かつ効果的に特定し治療を行うことのできる ML 技術を駆使することで、コンピュータ支援診断システムに可能性を見出すことができるのです。
このブログの記事では、これらのデータセットをダウンロードして、脊柱の特徴または特性に基づいて、正常または異常な整形外科的あるいは脊髄の病状 (ヘルニアまたは脊椎すべり症) を有するかどうかを予測するための例を提示しています。これらの病状の特性を考慮する予備診断ツールは、高い偽陽性率を有します。MRI は、腰椎椎間板ヘルニアの抑制を検出するのに使用しますが、この技法では ~ 33% の偽陽性率を有します。診断に用いる脊髄ブロック (注射) は、22% から 47% の偽陽性率があります。(注: これを ML モデルを評価する際のベースラインとして使用します)。
これらのデータセットは、マルチクラスおよびバイナリ分類問題の両方を提示します。
病理予測のための Amazon SageMaker での ML モデルの作成
この投稿では、マルチクラスのカテゴリ分類モデルとバイナリ分類モデルという 2 つのモデルを作成し、両方を評価します。マルチクラスのカテゴリ分類は、正常、椎間板ヘルニア、または脊椎すべり症の病状を有するかどうかを予測します。バイナリ分類はバイナリ応答を予測します。0 – 正常、または 1 – 異常です。
この例では、高次レベルでの手順を実行しています。
- Amazon SageMaker Jupyter ノートブックを用意する
- Amazon SageMaker を使用して、Amazon Simple Storage Service (S3) からデータセットをロードする
- Amazon SageMaker XGBoost (eXtreme GradientBoosting) アルゴリズムを使用して、モデルを評価する
- Amazon SageMaker 上でモデルをホストして、予測を継続する
- テストデータセットで、最終的な予測を生成する
設定
first notebook をダウンロードし、SageMaker インスタンスにアップロードしてから、このブログの投稿に従ってください。まず、以下を指定してみましょう。
- データに対するラーニングとホスティングのアクセスを与えるのに使用する Amazon SageMaker ロールの Amazon Resource Name (ARN) を指定するノートブックインスタンス、トレーニング、および / またはホスティングに複数のロールが必要な場合は、boto3 コールを適切で完全な Amazon SageMaker ロールの ARN 文字列に置き換える必要があることに注意してください。
- モデルオブジェクトのトレーニングおよび保存に使用する Amazon S3 バケットを指定する
Attribute-Relation File Format (ARFF) 形式は、データセットを与えられた際に使用するフォーマットなので、liac-arff もインストールします。
import os import boto3 import time import re
from sagemaker import get_execution_role
!pip install --upgrade pip
!pip install liac-arff #(install this package to import arff)

role = get_execution_role()
ここで、分析中に使用する、関連する Python ライブラリをインポートする必要があります。
import pandas as pd                                     # For munging tabular data
import numpy as np                                      # For matrix operations and numerical processing
import matplotlib.pyplot as plt                         # For charts and visualizati ons
import io                                               # For working with stream data
from time import gmtime, strftime                       # For labeling SageMaker mod els, endpoints, etc.
import json                                             # For parsing hosting output
import sagemaker.amazon.common as smac                  # For protobuf data format
import arff                                             # For installing Liac-arff module (https://pypi.python.org/pypi/liac-arff) that implements functions to re ad and write ARFF files in Python
import csv                                              # For converting ARFF to CSV for AWS S3 to read
from random import shuffle                              # For randomizing or shuffli ng data
import requests, zipfile, StringIO                      # For unzipping and extracti ng files from zipped files
import sklearn as sk                                    # For access to a variety of machine learning models
from IPython.display import Image                       # For displaying images in t he notebook
from IPython.display import display                     # For displaying outputs in the notebook
from sklearn.datasets import dump_svmlight_file         # For outputting data to lib svm format for xgboost
import sys                                              # For writing outputs to notebook
import math                                             # For ceiling function
この例で使用する Amazon S3 バケットを定義しましょう。
bucket = '<Your bucket name>'                      #enter your s3 bucket where you will copy data and model artifacts
prefix = 'sagemaker/xgboost-multiclass'    # place to upload training files with in the bucket
データ
データは、2 つの別々のファイル (column_2c_weka.arff と column_3c_weka.arff) で提供されます。列名は両方のファイルにあります。
ホストした zip ファイル (“vertebral_column_data”) は、4 つのデータファイルで構成され、そのうちの 2 つは実際のデータと属性 (バイナリ分類の場合は column_2C_weka.arff、カテゴリ分類の場合は column_3C_weka.arff) を含んでいます。データセットは、310 人の患者記録を表す 310 行で構成されています。
クラスと属性
 このデータセットは、患者の 6 つの生体力学的特性、および結果、あるいは病状を含んでいます。属性は、脊柱 (脊椎骨、無脊椎動物の椎間板、神経、筋肉、髄質および関節のグループ) を説明しています。これらの脊髄 – 骨盤系パラメータは、骨盤形態角度 (PI)、骨盤回旋角度 (PT)、前弯角度、仙骨傾斜角度 (SS)、骨盤半径、および滑り度を含みます。
各患者は、骨盤と腰椎 (この順で) の形状および方向から得られる 6 つの生体力学的属性 (骨盤形態角度、骨盤回旋角度、腰椎前弯角度、仙骨傾斜角度、骨盤半径、および脊椎すべり症の等級) を有します。正常 (NO)、および異常 (AB)、またはマルチクラス: DH (椎間板ヘルニア)、脊椎すべり症 (SL)、正常 (NO) のいずれかのバイナリで、各患者のクラスまたは診断も含みます。
準備
Amazon S3 へデータを XGBoost が読み取れる形式で取得するため、圧縮したファイルから関連するファイルを抽出し、CSV に変換して Amazon S3 バケットに追加しました。これで、Amazon S3 と Amazon SageMaker がデータを読み取れるようになります。
ファイルの抽出と変換前データの読み取り
import requests, zipfile, StringIO
f_zip = 'http://archive.ics.uci.edu/ml/machine-learning-databases/00212/verteb ral_column_data.zip'

r = requests.get(f_zip, stream=True)
Vertebral_zip = zipfile.ZipFile(StringIO.StringIO(r.content)) Vertebral_zip.extractall()
##If extracting only particular file
#Vertebral_zip.extract('column_2C_weka.arff')

# Reading Arff --> Data --> Binary/Categorical Conversion --> CSV
data_dict = arff.load(open('column_3C_weka.arff', 'rb'))                 #Read arff for multiclass
data_arff = data_dict["data"]                                            #List of Datapoints only
変換
今度は、抽出したファイルを取り込み、適切な形式 (バイナリの場合は Ortho_dataset.csv、マルチクラスの場合は Ortho_dataset_2.csv) で、.csv ファイルに変換します。XGBoost は、バイナリ属性を 0 と 1 に分類する必要があります。したがって、バイナリ分類ファイルでは、クラス変数列「診断」の「異常」と「正常」をそれぞれ「1」と「0」に置き換え、マルチクラスのカテゴリ分類ファイルでは、「正常」、「ヘルニア」および「脊椎すべり症」をそれぞれ「0」、「1」、「2」に置き換えました。
.arff ファイルを読み取り、.csv 形式に変換するには、次の Python スクリプトを参照してください。
shuffle(data_arff) #Shuffle the patients within the dataset
attributes_tup = data_dict["attributes"] #Extract attribute tuples
Attributes = []
for i in attributes_tup: #Extract only relevant attribute names
    for tup in i[::2]:
        Attributes.append(tup)

Ortho_dataset_2= [Attributes]+ data_arff


## Changing to categorical  values : "Hernia" to 1 and "Normal" to 0, "Spondylolisthesis" to 2
for row in Ortho_dataset_2:
    for i in row:
        if i == "Hernia":
            row.remove(i)
            row.append("1")
        if i == "Normal":
            row.remove(i)
            row.append("0")
        if i == "Spondylolisthesis":
            row.remove(i)
            row.append("2")

#Writing dataset to CSV
def writeCsvFile(filename, dataset):
    """
    @filename: string, filname to save it as
    @dataset: list of list of items

    Write data to file
    """
    mycsv = csv.writer(open(filename, 'wb'))
    for row in dataset:
        mycsv.writerow(row)

##For Multi-class:
writeCsvFile('Ortho_dataset_2.csv', Ortho_dataset_2)

# read the data
data = pd.read_csv('Ortho_dataset_2.csv', header = 0) #Header is zero to indicate first row's column headers

# save the data
data.to_csv("Mdata.csv", sep=',', index=False)

# read test data
data_test = pd.read_csv('Ortho_dataset_2.csv', header = 0, skiprows=0) #Header is zero to indicate first row's column headers

# set column names
data.columns = ["pelvic_incidence","pelvic_tilt","lumbar_lordosis_angle","sacral_slope","pelvic_radius",
                     "degree_spondylolisthesis","diagnosis"]


data_test.columns = ["pelvic_incidence","pelvic_tilt","lumbar_lordosis_angle","sacral_slope","pelvic_radius",
                     "degree_spondylolisthesis","diagnosis"]

##Create data bins to move diagnosis column to the first column
diagnosis_col = data.iloc[:,6]  #Diagnosis columns

#Creating new dataframe with diagnosis as first column

mdata_test_bin = pd.concat([diagnosis_col, data_test.iloc[:, 0:6]], axis=1)
mdata_bin = pd.concat([diagnosis_col, data.iloc[:, 0:6]], axis = 1)

# Set column names for dataframes

mdata_bin.columns = ["diagnosis","pelvic_incidence","pelvic_tilt","lumbar_lordosis_angle","sacral_slope","pelvic_radius",
                     "degree_spondylolisthesis"]
mdata_test_bin.columns = ["diagnosis","pelvic_incidence","pelvic_tilt","lumbar_lordosis_angle","sacral_slope","pelvic_radius",
                     "degree_spondylolisthesis"]
データ検索
次に、データのサイズ、さまざまなフィールド、異なる特性が取る値、およびターゲット値の分布を知るために、データセットを調べます。
データの検索と変換
データが多いほど、ML モデルがより効果的になり、潜在的により高い精度を得ることができます。このブログ投稿で使用しているデータセットは非常に限られているため、どの特性も削除していません。この方法論は、より大きなデータセットに適用できます。
# set display options
pd.set_option('display.max_columns', 100)     # Make sure we can see all of the columns
pd.set_option('display.max_rows', 6)         # Keep the output on one page


# # display positive and negative counts
# display(data.iloc[:,6].value_counts())
display(data_test.iloc[:,6].value_counts())


#display the data sets post column changes
# display(mdata_bin)
# display(mdata_test_bin)

# count number of positives and negatives
display(mdata_bin.iloc[:,0].value_counts())
print("data_test:")
display(mdata_test_bin.iloc[:,0].value_counts())
データヒストグラムと相関関係
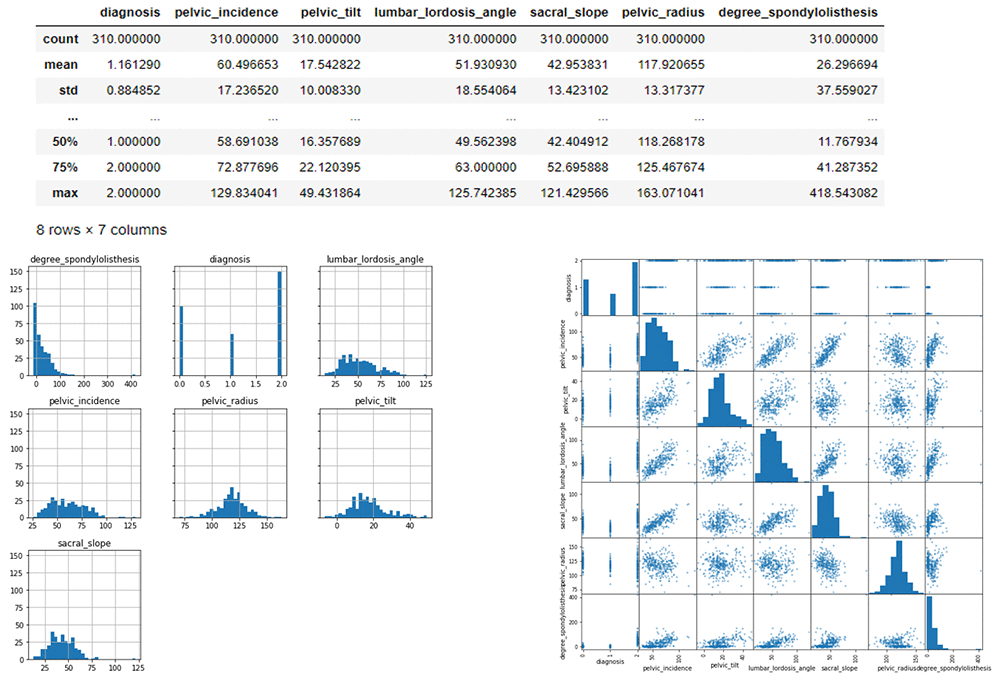
ここでは、データを視覚化して、ヒストグラムと散乱行列の各特性内でのデータの拡散を確認します。散布図行列には、変数のペア間の相関関係が表示されます。散布図行列は、1 ヶ所で全ての一対相関を見ることができます。
# Histograms for each numeric features display(mdata_bin.describe())
%matplotlib inline
hist = mdata_bin.hist(bins=30, sharey=True, figsize=(10, 10))

##correlation display(mdata_bin.corr())
pd.plotting.scatter_matrix(mdata_bin,figsize=(12, 12)) plt.show()
データ記述
さて、データについてです。高次レベルでは、次のものを見ることができます。
- トレーニングデータには、7 つの列と 217 の行があります。
- テストデータは、7 列と 93 行あります。
- 診断がターゲットフィールドです。
特性の詳細 :
ターゲット変数:
- 診断: マルチクラス: 患者がヘルニア、脊椎すべり症を有するか、または正常かバイナリか: 患者が異常な背骨条件を有するかどうか。
トレーニング
最初のトレーニングアルゴリズムでは、 xgboost アルゴリズムを使用します。 xgboost は、勾配ブースティング木のための、一般的なオープンソースのパッケージです。計算においてパワフルで、十分な機能を有しており、多くの機械学習コンテストで使用され成功を収めています。シンプルなものから始めてみましょう。 xgboost は、Amazon SageMaker が管理する分散トレーニングフレームワークを使用してトレーニングしたモデルです。
初めに、トレーニングパラメータを指定する必要があります。これには、次のものが含まれます。
- 使用するロール
- トレーニングジョブ名
xgboost アルゴリズムコンテナ- トレーニングインスタンスのタイプとカウント
- トレーニングデータのための Amazon S3 の場所
- 出力データのための Amazon S3 の場所
- アルゴリズムハイパーパラメータ
サポートするトレーニング入力形式は csv、libsvm です。csv 入力の場合、入力は区切り文字で区切られており (Python のビルトインスニファツールを使用してセパレーターを自動的に検出します)、ヘッダー行はなく、ラベルは最初の列にあると仮定します。スコアリング出力形式は csv です。データは CSV 形式ですので、データセットを Amazon SageMaker XGBoost がサポートする方法に変換します。ターゲットフィールドを最初の列に、残りの特性は次の数列に残しておきます。ヘッダー行を削除します。データを、別々のトレーニングセットと検証セットに分割します。最後に、Amazon S3 バケットにデータを保存します。
XGBoost を呼び出す前に、データを 70% のトレーニングと 15% の検証に分割し、保存します。
# Split the data randomly as 70% for training and remaining 30% and save them locally
mtrain_list = np.random.rand(len(mdata_bin)) < 0.7
mdata_train = mdata_bin[mtrain_list]
mdata_val = mdata_bin[~mtrain_list]
mdata_train.to_csv("mformatted_train.csv", sep=',', header=False, index=False)         # save training data
mdata_val.to_csv("mformatted_val.csv", sep=',', header=False, index=False)             # save validation data
mdata_test_bin.to_csv("mformatted_test.csv", sep=',', header=False,  index=False)      # save test data
後ろに接頭辞が付いた S3 バケットに、トレーニングと検証のデータセットをアップロードする。(例: ‘train/’)
mtrain_file = 'mformatted_train.csv'
mval_file = 'mformatted_val.csv'

boto3.Session().resource('s3').Bucket(bucket).Object(os.path.join(prefix, 'train/', mtrain_file)).upload_file(mtrain_file)
boto3.Session().resource('s3').Bucket(bucket).Object(os.path.join(prefix, 'val/', mval_file)).upload_file(mval_file)
モデルに基づいたパラメータを指定する
- マルチクラス: objective: “multi:softmax”, num_class: “3”
- バイナリ: objective: “binary:logistic”, eval_metric: “error@t” (t はエラーのスコアしきい値)
Mxgboost_containers = {'us-west-2' : '433757028032.dkr.ecr.us-west-2.amazonaws.com/xgboost:latest',
                    'us-east-1' : '811284229777.dkr.ecr.us-east-1.amazonaws.com/xgboost:latest',
                    'us-east-2' : '825641698319.dkr.ecr.us-east-2.amazonaws.com/xgboost:latest',
                    'eu-west-1' : '685385470294.dkr.ecr.eu-west-1.amazonaws.com/xgboost:latest'}
import boto3
from time import gmtime, strftime

mjob_name = 'Mxgboost-ortho' + strftime("%Y-%m-%d-%H-%M-%S", gmtime())
print("Training job", mjob_name)

mcreate_training_params = \
{
    "AlgorithmSpecification": {
        "TrainingImage": Mxgboost_containers[boto3.Session().region_name],
        "TrainingInputMode": "File"
    },
    "RoleArn": role,
    "OutputDataConfig": {
        "S3OutputPath": "s3://{}/{}/single-xgboost/".format(bucket, prefix),
    },
    "ResourceConfig": {
        "InstanceCount": 1,
        "InstanceType": "ml.m4.4xlarge",
        "VolumeSizeInGB": 1000
    },
    "TrainingJobName": mjob_name,
    "HyperParameters": {
        "max_depth":"5",
        "eta":"0.1",
        "gamma":"1",
        "min_child_weight":"1",
        "silent":"0",
        "objective": "multi:softmax", #for multiclass
        "num_round": "20",
        "num_class": "3", #remove if not multiclass
    },
    "StoppingCondition": {
        "MaxRuntimeInSeconds": 60 * 60
    },
    "InputDataConfig": [
        {
            "ChannelName": "train",
            "DataSource": {
                "S3DataSource": {
                    "S3DataType": "S3Prefix",
                    "S3Uri":  "s3://{}/{}/train/".format(bucket, prefix),
                    "S3DataDistributionType": "FullyReplicated"
                }
            },
            "ContentType": "csv",
            "CompressionType": "None"
        },
        {
            "ChannelName": "validation",
            "DataSource": {
                "S3DataSource": {
                    "S3DataType": "S3Prefix",
                    "S3Uri": "s3://{}/{}/val/".format(bucket, prefix),
                    "S3DataDistributionType": "FullyReplicated"
                }
            },
            "ContentType": "csv",
            "CompressionType": "None"
        }
    ]
}
%%time

region = boto3.Session().region_name sm = boto3.client('sagemaker')

sm.create_training_job(**mcreate_training_params)

status = sm.describe_training_job(TrainingJobName=mjob_name)['TrainingJobStatu s']
print(status) sm.get_waiter('training_job_completed_or_stopped').wait(TrainingJobName=mjob_name)
if status == 'Failed':
message = sm.describe_training_job(TrainingJobName=mjob_name)['FailureReas on']
print('Training failed with the following error: {}'.format(message)) raise Exception('Training job failed')

# Estimated Time: ~6 minutes
ホスティング
データ内の xgboost アルゴリズムをトレーニングしたので、後でホストできるモデルを設定しましょう。以下の作業を実行します。
- スコアリングコンテナを提示する
- 生じた Model.tar.gz を提示する
- ホスティングモデルを作成する
model_name=mjob_name + '-mdl' Mxgboost_hosting_container = {
'Image': Mxgboost_containers[boto3.Session().region_name], 'ModelDataUrl': sm.describe_training_job(TrainingJobName=mjob_name)['Mo
delArtifacts']['S3ModelArtifacts'], 'Environment': {'this': 'is'}
}

create_model_response = sm.create_model( ModelName=model_name, ExecutionRoleArn=role,
PrimaryContainer=Mxgboost_hosting_container)
print(create_model_response['ModelArn'])
print(sm.describe_training_job(TrainingJobName=mjob_name)['ModelArtifacts']['S3ModelArtifacts'])
モデルの設定後、ホスティングエンドポイントの設定を構成することができます。ここでは、以下のように指定します。
- ホスティングに使用する EC2 インスタンスタイプ
- インスタンスの最初の数字
- ホスティングモデル名
from time import gmtime, strftime

mendpoint_config_name = 'MXGBoostEndpointConfig-' + strftime("%Y-%m-%d-%H-%M-%S", gmtime())
print(mendpoint_config_name)
create_endpoint_config_response = sm.create_endpoint_config(
    EndpointConfigName = mendpoint_config_name,
    ProductionVariants=[{
        'InstanceType':'ml.m4.xlarge',
        'InitialInstanceCount':1,
        'InitialVariantWeight':1,
        'ModelName':model_name,
        'VariantName':'AllTraffic'}])

print("Endpoint Config Arn: " + create_endpoint_config_response['EndpointConfigArn'])
エンドポイントを作成する
最後に、前に定義した名前と構成を指定して、モデルを表示するエンドポイントを作成します。最終結果は、検証され、製品アプリケーションに組み込まれるエンドポイントです。完了するのに、約 7 分から 11 分かかります。
%%time
import time

mendpoint_name = 'MXGBoostEndpoint-' + strftime("%Y-%m-%d-%H-%M-%S", gmtime())
print(mendpoint_name)
create_endpoint_response = sm.create_endpoint(
    EndpointName=mendpoint_name,
    EndpointConfigName=mendpoint_config_name)
print(create_endpoint_response['EndpointArn'])

resp = sm.describe_endpoint(EndpointName=mendpoint_name)
status = resp['EndpointStatus']
print("Status: " + status)

while status=='Creating':
    time.sleep(60)
    resp = sm.describe_endpoint(EndpointName=mendpoint_name)
    status = resp['EndpointStatus']
    print("Status: " + status)

print("Arn: " + resp['EndpointArn'])
print("Status: " + status)
予測
作成されたモデルがこちらです。このモデルは、値を予測するために使用されます。
runtime= boto3.client('runtime.sagemaker')
# Simple function to create a csv from our numpy array

def np2csv(arr):
    csv = io.BytesIO()
    np.savetxt(csv, arr, delimiter=',', fmt='%g')
    return csv.getvalue().decode().rstrip() (csv, arr, delimiter=',', fmt='%g') return csv.getvalue().decode().rstrip()
# Function to generate prediction through sample data
def do_predict(data, endpoint_name, content_type):

    payload = np2csv(data)
    response = runtime.invoke_endpoint(EndpointName=endpoint_name,
                                   ContentType=content_type,
                                   Body=payload)
    result = response['Body'].read()
    result = result.decode("utf-8")
    result = result.split(',')
    preds = [float((num)) for num in result]
    return preds

# Function to iterate through a larger data set and generate batch predictions
def batch_predict(data, batch_size, endpoint_name, content_type):
    items = len(data)
    arrs = []

    for offset in range(0, items, batch_size):
        if offset+batch_size < items:
            datav = data.iloc[offset:(offset+batch_size),:].as_matrix()
            results = do_predict(datav, endpoint_name, content_type)
            arrs.extend(results)
        else:
            datav = data.iloc[offset:items,:].as_matrix()
            arrs.extend(do_predict(datav, endpoint_name, content_type))
        sys.stdout.write('.')
    return(arrs)
### read the saved data for scoring
mdata_train = pd.read_csv("mformatted_train.csv", sep=',', header=None)
mdata_test = pd.read_csv("mformatted_test.csv", sep=',', header=None)
mdata_val = pd.read_csv("mformatted_val.csv", sep=',', header=None)
# display(mdata_val.iloc[:,0].value_counts())
トレーニング、検証、およびテストセットに関する予測を生成する
mpreds_train_xgb = batch_predict(mdata_train.iloc[:, 1:], 1000, mendpoint_name, 'text/csv')
mpreds_val_xgb = batch_predict(mdata_val.iloc[:, 1:], 1000, mendpoint_name, 'text/csv')
mpreds_test_xgb = batch_predict(mdata_test.iloc[:,1:],1000, mendpoint_name, 'text/csv')
マルチクラスカテゴリのモデル精度を評価する
機械学習モデルの性能を比較するには、多くの方法があります。
マルチクラスモデルでは、一般的に、バイナリモデルで通常使用される ROC 曲線の下の面積で示される AUC スコアではなく、F1 値を使用します。F1 値とは、モデル内の全てのクラスの精度と再現率の統計的尺度です。スコアの範囲は 0 から 1 で、スコアが高いほど、モデルの精度は良くなります。例えば、~0.9 の F1 値は、0.7 のスコアを持つモデルよりも良いモデルであることを示します。
その他の評価基準には、感度、真陽性率、精度、または陽性適中率が含まれます。これに関しては、バイナリ分類の例で詳しく説明します。
from sklearn import metrics
mtrain_labels = mdata_train.iloc[:,0];
mval_labels = mdata_val.iloc[:,0];
mtest_labels = mdata_test.iloc[:,0];

Training_f1 = metrics.f1_score(mtrain_labels, mpreds_train_xgb, average=None)
Validation_f1= metrics.f1_score(mval_labels, mpreds_val_xgb, average=None)
# fbeta_test= metrics.f1_score(mtest_labels, mpreds_test_xgb, average=None)
prec, rec, fbeta_test, support = metrics.precision_recall_fscore_support(mtest_labels, mpreds_test_xgb, average = None)
metrics.precision_recall_fscore_support(mtest_labels, mpreds_test_xgb, average = None)

print"Average Training F1 Score", (Training_f1[0]+Training_f1[1]+Training_f1[2])/3 ##0.95594
print"Average Validation F1 Score", (Validation_f1[0]+Validation_f1[1]+Validation_f1[2])/3 ##0.7922

print "Test Evaluation: "
print "Average F1 Score: ", (fbeta_test[0]+fbeta_test[1]+fbeta_test[2])/3 ##0.91
print "Normal F1 Score: ", fbeta_test[0] ## 0.8944
print "Hernia F1 Score: ", fbeta_test[1] ## 0.8524
print "Spondylosisthesis F1 Score: ", fbeta_test[2] ## 0.9832
print "Average Precision Score: ", (prec[0]+prec[1]+prec[2])/3 ##0.91
print "Average Sensitivity/TPR Score: ", (rec[0]+rec[1]+rec[2])/3 ##0.91
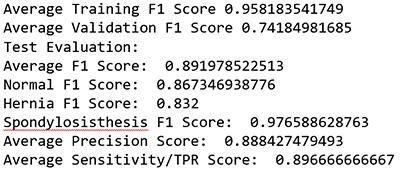
この ML モデルの平均 F1 スコアは ~0.9 でした。
混同行列
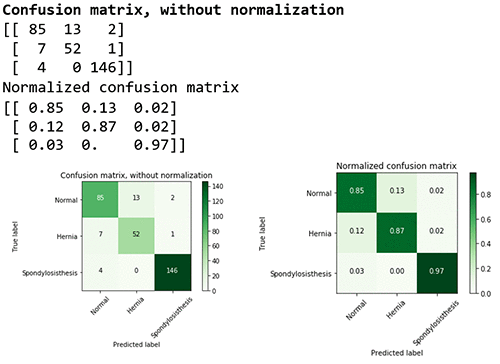
混乱行列を考察することで、各クラスの性能を詳しく調べることもできます。
混同行列は、マルチクラス分類予測モデルの精度に基づいて、性能を視覚的に表すことができます。この表では、真陽性と偽陽性の割合を知ることができます。
import itertools

class_names = ["Normal","Hernia", "Spondylosisthesis"]
def plot_confusion_matrix(cm, classes,
                          normalize=False,
                          title='Confusion matrix',
                          cmap=plt.cm.Greens):
    """
    This function prints and plots the confusion matrix.
    Normalization can be applied by setting `normalize=True`.
    """
    if normalize:
        cm = cm.astype('float') / cm.sum(axis=1)[:, np.newaxis]
        print("Normalized confusion matrix")
    else:
        print('Confusion matrix, without normalization')

    print(cm)

    plt.imshow(cm, interpolation='nearest', cmap=cmap)
    plt.title(title)
    plt.colorbar()
    tick_marks = np.arange(len(classes))
    plt.xticks(tick_marks, classes, rotation=45)
    plt.yticks(tick_marks, classes)

    fmt = '.2f' if normalize else 'd'
    thresh = cm.max() / 2.
    for i, j in itertools.product(range(cm.shape[0]), range(cm.shape[1])):
        plt.text(j, i, format(cm[i, j], fmt),
                 horizontalalignment="center",
                 color="white" if cm[i, j] > thresh else "black")

    plt.tight_layout()
    plt.ylabel('True label')
    plt.xlabel('Predicted label')
例えば、脊椎すべり症のクラス (または診断) の精度が高い (97%) ことが分かります。評価データセットでは、150 例中 146 例が正確に予測されています。0.97 の F1 スコアも、比較的高いと言えます。しかし、ヘルニアのクラスの F1 スコアは 0.85 と低く、モデルが正常病態と混同していたことを示しています。マルチクラスモデルの評価および見解の詳細については、Multiclass Model Insights: https://docs.thinkwithwp.com/machine-learning/latest/dg/multiclass-model-insights.html をご参照ください。
# Compute confusion matrix
cnf_matrix = metrics.confusion_matrix(mtest_labels, mpreds_test_xgb) np.set_printoptions(precision=2)

# Plot non-normalized confusion matrix plt.figure()
plot_confusion_matrix(cnf_matrix, classes=class_names,
title='Confusion matrix, without normalization')

# Plot normalized confusion matrix plt.figure()
plot_confusion_matrix(cnf_matrix, classes=class_names, normalize=True,
title='Normalized confusion matrix')

plt.show()
#Confusion matrix, without normalization
完了したら、次のコマンドを実行し、エンドポイントを削除します。
sm.delete_endpoint(EndpointName=mendpoint_name)
バイナリ分類のモデル
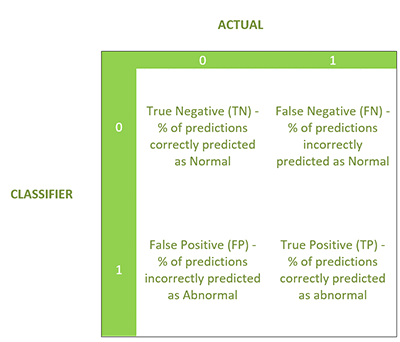
ここで、二値応答 (0 または 1) を生成するバイナリ分類モデルを示します。この場合、0 は正常、1 は異常です。この評価では、同様の混同行列で以下の 4 つの統計を生成します。
設定、データ、およびトレーニング
バイナリの設定は、マルチクラスカテゴリの設定と類似しています。パート 2 のノートブックをダウンロードして、このセクションを開始しましょう。ですが、いくつか異なる部分がありますので、注意してください。
データファイルの抽出:
# Reading Arff --> Data --> Binary/Categorical Conversion --> CSV
data_dict = arff.load(open('column_2C_weka.arff', 'rb')) #Read arff for binary
変換 :
## Changing to binary values : "Abnormal" to 1 and "Normal" to 0 for row in Ortho_dataset:
for i in row:
if i == "Abnormal": row.remove(i) row.append("1")
if i == "Normal": row.remove(i) row.append("0")
最終的にデータセットは 310 行あり、200 は異常、100 は正常です。
トレーニングでは、ハイパーパラメータが異なります。
モデルに基づいてパラメータを指定します (例: objective: binary:logistic, eval_metric: error@0.40)。
 "HyperParameters": {
        "max_depth":"5",
        "eta":"0.1",
        "gamma":"1",
        "min_child_weight":"1",
        "silent":"0",
        "objective": "binary:logistic", #for binary
        # "eval_metric": "auc", #for binary with no threshold adjustment
        "eval_metric": "error@.40", #for binary with threshold adjustment
        "num_round": "20",
バイナリ分類モデルの評価指標
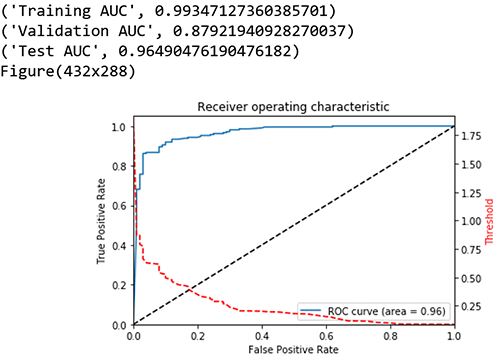
バイナリ分類の場合、モデルは曲線の下の面積で示される AUC をスコアとして使用します。AUC は、バイナリ分類 ML モデルの品質を測定するために使用される指標です。0.5 から 1 の範囲にあり、AUC スコアが高いほど、ML モデルの品質が高いことを示します。この場合、スコアのしきい値を調整することもできます。
トレーニング、検証、テストデータセットの性能指標を計算する
変化するしきい値に基づいた真陽性率対偽陽性率のグラフプロットを見てみます。目標は、高い真陽性率 (TPR または感度) および低い偽陽性率 (FPR またはフォールアウト) を有し、その結果、より高い AUC を有することです。
from sklearn import metrics
from sklearn.metrics import roc_auc_score
train_labels = data_train.iloc[:,0];
val_labels = data_val.iloc[:,0];
test_labels = data_test.iloc[:,0];

##below is only for Binary
print("Training AUC", roc_auc_score(train_labels, preds_train_xgb)) ##0.9934
print("Validation AUC", roc_auc_score(val_labels, preds_val_xgb) )###0.8792
print("Test AUC", roc_auc_score(test_labels, preds_test_xgb) )###0.9649

fpr, tpr, thresholds = metrics.roc_curve(test_labels, preds_test_xgb)
roc_auc = metrics.auc(fpr, tpr) # compute area under the curve

plt.figure()
plt.plot(fpr, tpr, label='ROC curve (area = %0.2f)' % (roc_auc))
plt.plot([0, 1], [0, 1], 'k--')
plt.xlim([0.0, 1.0])
plt.ylim([0.0, 1.05])
plt.xlabel('False Positive Rate')
plt.ylabel('True Positive Rate')
plt.title('Receiver operating characteristic')
plt.legend(loc="lower right")

# create the axis of thresholds (scores)
ax2 = plt.gca().twinx()
ax2.plot(fpr, thresholds, markeredgecolor='r',linestyle='dashed', color='r')
ax2.set_ylabel('Threshold',color='r')
ax2.set_ylim([thresholds[-1],thresholds[0]])
ax2.set_xlim([fpr[0],fpr[-1]])

print(plt.figure())
その他のモデル評価指標
- F1 スコア: 精度と再現率の加重平均
- 感度、ヒット率、再現率、または真陽性率
- 特異性、または真陰性率
- 精度、または陽性適中率
- 陰性適中率 (NPV)
- フォールアウトまたは偽陽性率 (FPR)
- 偽陰性率 (FNR)
- 偽発見率 (FDR)
- 全体的な精度
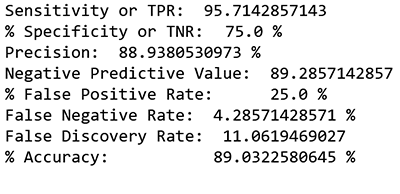
ここでは、偽陰性がゼロに近くなるように、しきい値を調整して感度を高め、FNR を最小限に抑えます。
偽陰性の場合、または患者の診断がすでに遅すぎる場合、費用がかさんだり、治療がより積極的となり、患者の命を危険にさらすことがあります。したがって、ゼロに近い偽陰性を最小限に抑えることが正しいとは思いません。
この場合、0.3 の切り捨ての高い精度 (89%) と低いエラー率 (11%) で、4.3% の偽陰性に向かうようにしきい値を調整しました。エラーパーセンテージは、モデルが予測ミスをした割合を示します。エラー率は、この場合も偽陽性率で、25% に設定しています。Amazon SageMaker に基づくモデルを使用して、このデータセットで、この偽陽性 (FP) 率と MRI (33% FP) および診断ブロック (22%~47% FP) の業界基準値を比較すると、一般的に使用する他のツールの範囲内での結果であることが分かります。
threshold = 0.30 pred_test_labels = []
for i in range(len(preds_test_xgb)): if preds_test_xgb[i] > threshold:
pred_test_labels.append(1) else:
pred_test_labels.append(0)

TN, FP, FN, TP = metrics.confusion_matrix(test_labels, pred_test_labels).ravel ()
metrics.confusion_matrix(test_labels, pred_test_labels)

# Sensitivity, hit rate, recall, or true positive rate Sensitivity	= float(TP)/(TP+FN)*100
# Specificity or true negative rate Specificity	= float(TN)/(TN+FP)*100
# Precision or positive predictive value Precision = float(TP)/(TP+FP)*100
# Negative predictive value NPV = float(TN)/(TN+FN)*100
# Fall out or false positive rate FPR = float(FP)/(FP+TN)*100
# False negative rate
FNR = float(FN)/(TP+FN)*100
# False discovery rate
FDR = float(FP)/(TP+FP)*100
# Overall accuracy
ACC = float(TP+TN)/(TP+FP+FN+TN)*100

print "Sensitivity or TPR: ", Sensitivity, "%"	##95.7142% print "Specificity or TNR: ",Specificity, "%" ##75%
print "Precision: ",Precision, "%"	##88.938%
print "Negative Predictive Value: ",NPV, "%" ##89.285% print "False Positive Rate: ",FPR,"%" ##25%
print "False Negative Rate: ",FNR, "%" ##4.2857% print "False Discovery Rate: ",FDR, "%" ## 11.0619% print "Accuracy: ",ACC, "%" ##89.0322%
まとめ
このブログ投稿で分かるように、整形外科におけるバイナリの「異常」および「正常」病理分類は、重大な症例にラベル付けする (厳密な病理に完全に分類するのではなく) 意思決定支援システムを生み出す可能性があります。ML フィルタでは、整形外科医などの人間である専門家に、複雑かつ重大なケースは委ねられます。さらに、このアプローチはオピオイドを処方する際のガイドラインの要素を提供し、よって、オピオイドの処方を絞り込むことが可能となります。ML によるヘルスケア診断の発展への模索は、始まったばかりです。もっと多くのデータを入手し学んでいくことで、さらなる進歩を遂げることができるでしょう。
今回のブログ投稿者について
 Sunaina Ahuja Rajani は、ビデオゲーム、メディア、女の子用おもちゃ、イベント、さらに季節によっては 2 時間のお届けサービスを持つ e コマースチャンネル Prime Now をマネジメントしています。ヘルスケアと認知神経科学の分野で、学士号と修士号を取得しました。テキサス出身で、ユタ、ワシントンD.C.、ニューヨーク市、ケンブリッジに住んだことがあり、現在はシアトル在住です。ウォールストリートジャーナルやヘルスケアとテクノロジーに関するニュースを読むことの他、ダンス、サイクリング、投資、映画「マトリックス」3 部作を観るのが好きです。
 このデータセットは、患者の 6 つの生体力学的特性、および結果、あるいは病状を含んでいます。属性は、脊柱 (脊椎骨、無脊椎動物の椎間板、神経、筋肉、髄質および関節のグループ) を説明しています。これらの脊髄 – 骨盤系パラメータは、骨盤形態角度 (PI)、骨盤回旋角度 (PT)、前弯角度、仙骨傾斜角度 (SS)、骨盤半径、および滑り度を含みます。


 Sunaina Ahuja Rajani は、ビデオゲーム、メディア、女の子用おもちゃ、イベント、さらに季節によっては 2 時間のお届けサービスを持つ e コマースチャンネル Prime Now をマネジメントしています。ヘルスケアと認知神経科学の分野で、学士号と修士号を取得しました。テキサス出身で、ユタ、ワシントンD.C.、ニューヨーク市、ケンブリッジに住んだことがあり、現在はシアトル在住です。ウォールストリートジャーナルやヘルスケアとテクノロジーに関するニュースを読むことの他、ダンス、サイクリング、投資、映画「マトリックス」3 部作を観るのが好きです。

