AWS News Blog
Search and Browse Amazon CloudWatch Metrics in the Console
Amazon CloudWatch monitors your AWS cloud resources and the applications that you run on AWS. The basic unit of monitoring is a metric. Amazon EC2, Amazon RDS, and other AWS services collect metrics and forward them to CloudWatch, where they are stored for two weeks. The metrics can be graphed, and they can also be used to raise alerts and to drive Auto Scaling decisions. You can manage your metrics using the AWS Management Console.
Today we are making the console even better, giving you the ability to search for specific metrics and to browse all available metrics by category. Many of our customers have asked for a faster and more productive way to find the metrics that are of interest to them and we are happy to oblige.
Search
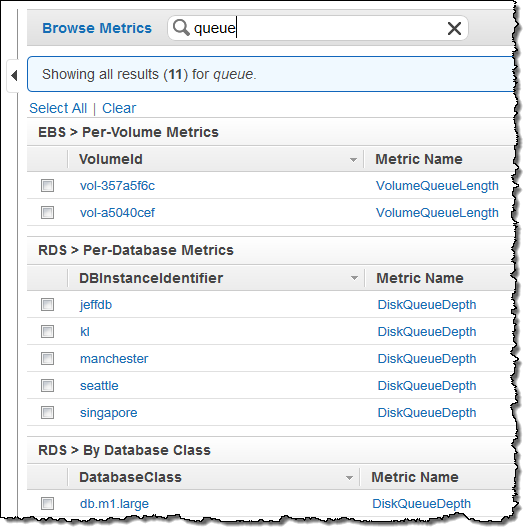
You can now search through all of your CloudWatch metrics in seconds, even if you have hundreds of thousands of them. Matches are displayed when you press the Enter key:

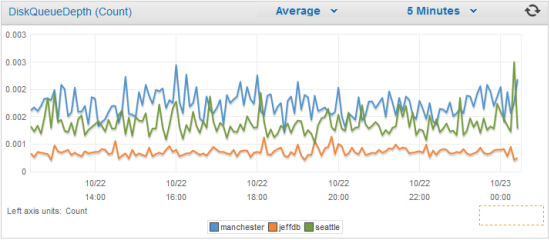
You can click on a highlighted term to add it to your search. After you locate and select the desired metric(s), you can click on the Update Graph button to display a colorful graph:

If you are viewing metrics with different units, drag a metric from the center legend into the box on the right to get a secondary Y-axis. This will make things easier to see.
Browse
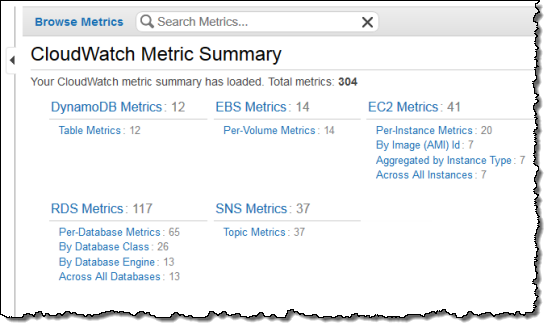
You can now click the Browse Metrics button in the CloudWatch dashboard to view your metrics organized by category. Click on a category to view a set of related metrics, and then click on a highlighted term to narrow down to the desired metric(s). This is also a good way to become familiar with new metrics as we introduce them, or when you start to use new services.

As always, these new features are available now and you can start using them today!
— Jeff;
PS – The Amazon CloudWatch team is very interested in your feedback on these features. Have the changes made your job easier? What do you want to see next? You can reach the team via email at cloudwatch-feedback [at] amazon [dot] com.