AWS News Blog
Amazon CloudWatch launches Alarms on Dashboards
|
|
September 8, 2021: Amazon Elasticsearch Service has been renamed to Amazon OpenSearch Service. See details.
Amazon CloudWatch is a service that gives customers the ability to monitor their applications, systems, and solutions running on Amazon Web Services by providing and collecting metrics, logs, and events about AWS resources in real time. CloudWatch automatically provides key resource measurements such as; latency, error rates, and CPU usage, while also enabling monitoring of custom metrics via customer-supplied logs and system data.
Last November, Amazon CloudWatch added new Dashboard Widgets to provide additional data visualization options for all available metrics. In order to provide customers with even more insight into their solutions and resources running on AWS, CloudWatch has launched Alarms on Dashboards. With this alarms enhancement, customers can view alarms and metrics in the same dashboard widget enabling them to perform data-driven troubleshooting and analysis.

CloudWatch dashboards are designed with a goal of providing better visibility when monitoring AWS resources across regions in a consolidated view. Since CloudWatch dashboards are highly customizable, users can create their own custom dashboards to graphically represent data for varying metrics such as utilization, performance, estimated billing, and now alarm conditions. An alarm tracks a single metric over time based on the value of the metric in relation to a specified threshold. When the alarm state changes, an action such an Auto Scaling policy is executed or a notification is sent to Amazon SNS, among other options.
With the ability to add alarms to dashboards, CloudWatch users have another mechanism to proactively monitor and receive alerts about their AWS resources and applications across multiple regions. In addition, the metric data associated with an alarm, which has been added to a dashboard, can be charted and reviewed. Alarms have three possible states:
- OK: The value of the alarm metric does not meet the threshold
- INSUFFICIENT DATA: Initial triggering of alarm metric or alarm metric data does not have enough data to determine whether it’s in the OK state or the ALARM state
- ALARM: The value of the alarm metric meets the threshold
When added to a dashboard, alarms are displayed in red when in the Alarm state, gray when in the Insufficient data state and shown with no color fill when the alarm is in the OK state. Alarms added to a dashboard are supported with the following widgets: Line, Number, and Stacked Graph widgets.
- Number widget: provides a quick and efficient view of the latest value of any desired metric. Using the widget with alarms, the view of the state of the alarm is shown with different background colors for the latest metric data.
- Line widget: allows the visualization of the actual value of any collection of chosen metrics. Provides a view on the dashboard of the state of the alarm, which displays the alarm threshold and condition as a horizontal line. The threshold line can act as a good indicator to view the degree of the alarm.
- Stack graph widget: allows customers to visualize the net total effect of any collection of chosen metrics. The stacked graph widget loads one metric over another in order to illustrate the distribution and contribution of a metric and has the option to display the contribution of metrics in percentages. With alarms, it also provides a view of the state of the alarm, which displays the alarm threshold and condition as a horizontal line.
Currently, adding multiple metrics onto the same widget for an alarm is in the works and this feature is evolving based on customer feedback.
Adding Alarms on Dashboards
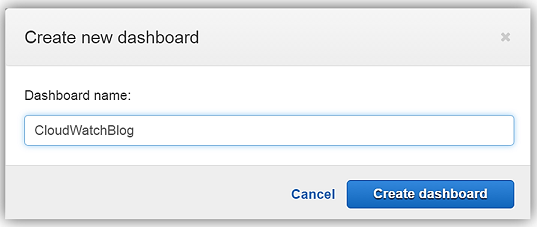
Let’s take a quick look at the utilizing the Alarms on a CloudWatch Dashboard. In the AWS Console, I will go to the CloudWatch service. When in the CloudWatch console, select Dashboards. I will click the Create dashboard button and create the CloudWatchBlog dashboard.

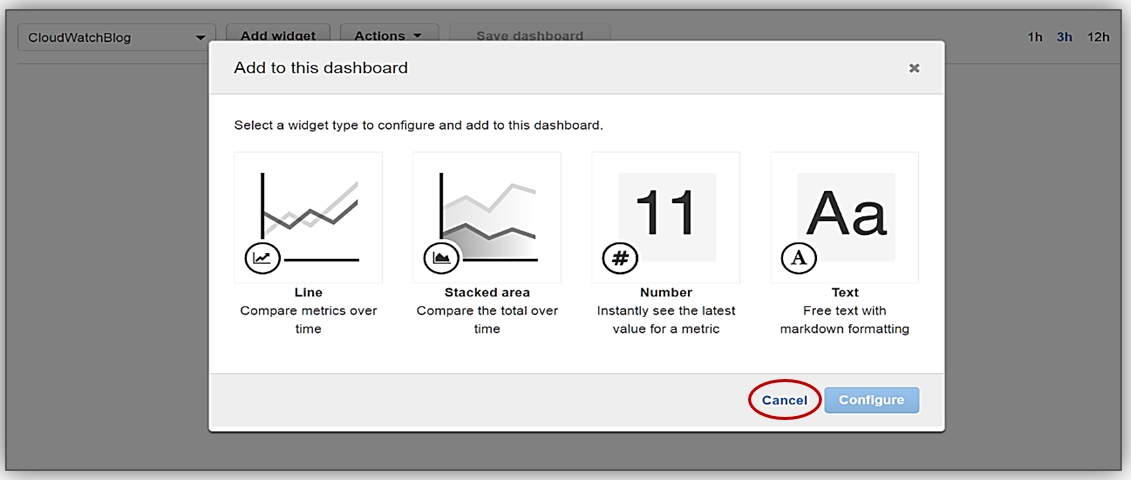
Upon creation of my CloudWatchBlog dashboard, a dialog box will open to allow me to add widgets to the dashboard. I will forego adding widgets for now since I want to focus on adding alarms on my dashboard. Therefore, I will hit the Cancel button here and go to the Alarms section of the CloudWatch console.
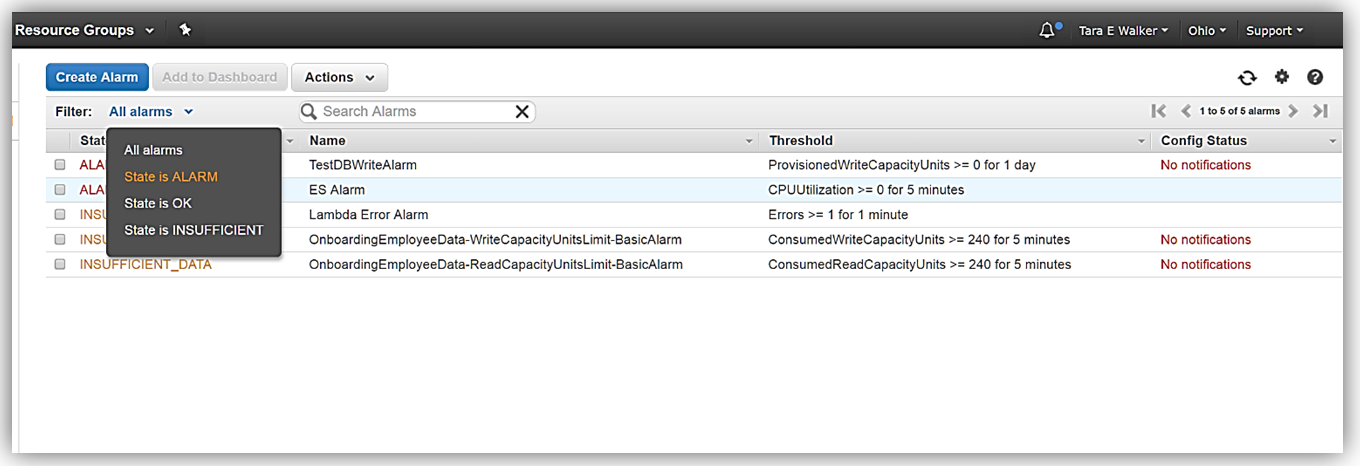
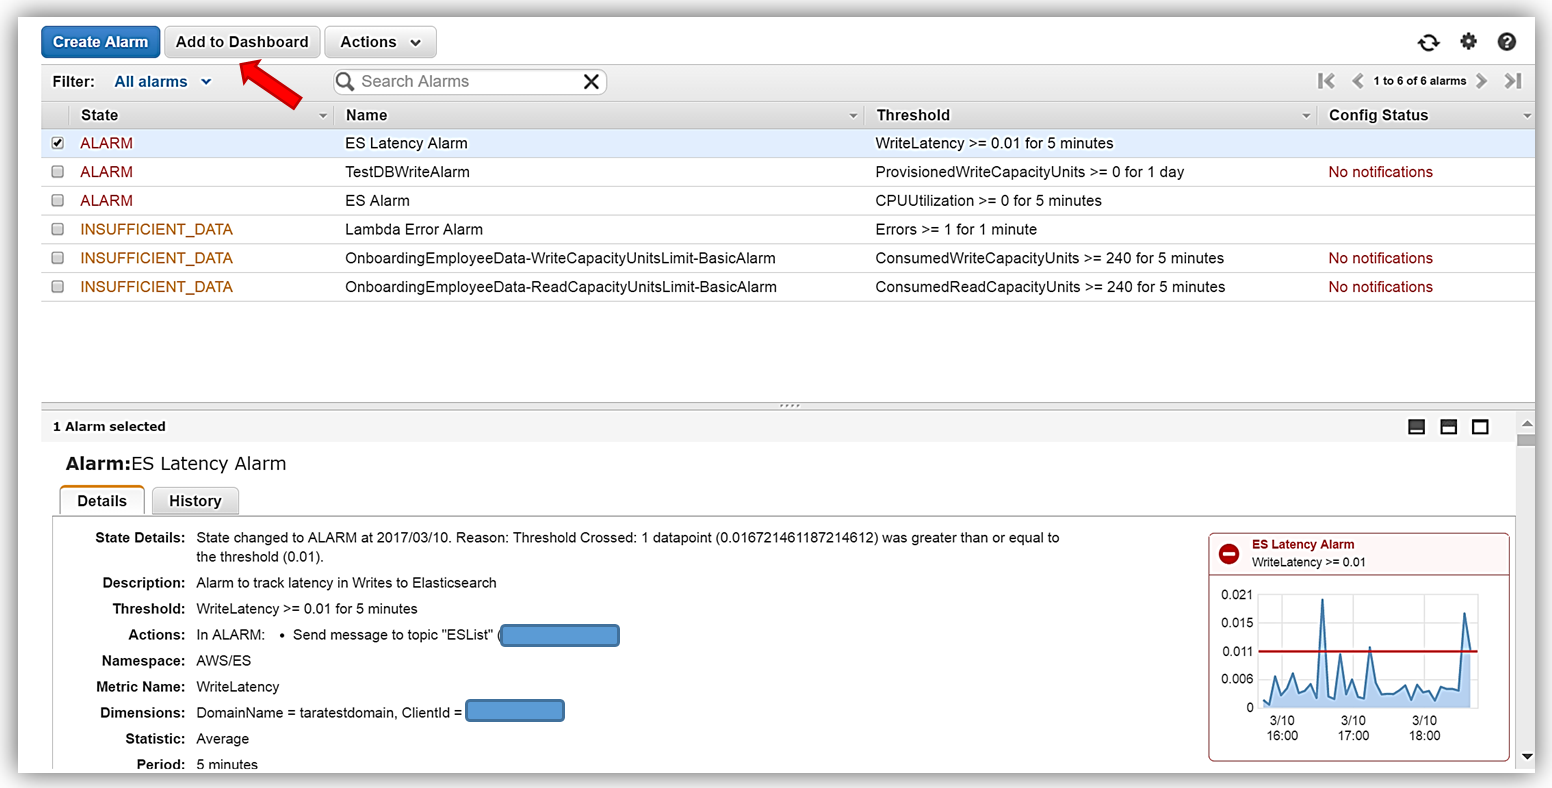
Once in the Alarms section of the CloudWatch console, you will see all of your alarms and the state of each of the alarms for the current region displayed.

As we mentioned earlier, there are three types of alarm states and as you can see in my console above that all of the different alarms states for various alarms are being displayed. If desired, you can adjust your filter on the console to display alarms filtered by the alarm state type.
As an example, I am only interested in viewing the alarms with an alarm state of ALARM. Therefore, I will adjust the filter to show only the alarms in the current region with an alarm state as ALARM.
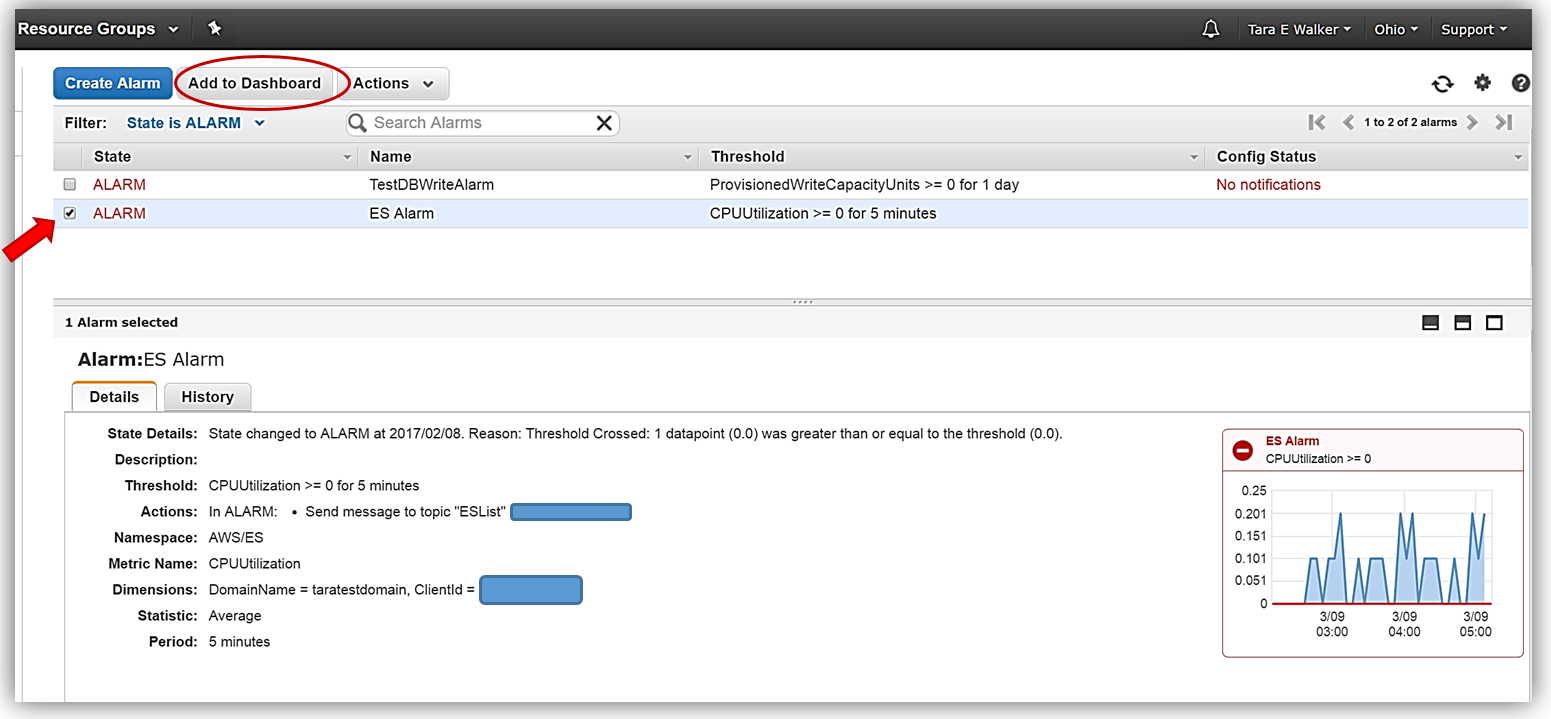
Now only the two alarms that have a current alarm state of ALARM are displayed. One of these alarms is for monitoring the provisioned write capacity units of an Amazon DynamoDB table, and the other is to monitor the CPU utilization of my active Amazon Elasticsearch instance.

Let’s examine the scenario in which I leverage my CloudWatchBlog dashboard as my troubleshooting mechanism for identifying and diagnosing issues with my Elasticsearch solution and its instances. I will first add the Amazon Elasticsearch CPU utilization alarm, ES Alarm, to my CloudWatchBlog dashboard. To add the alarm, I simply select the checkbox by the desired alarm, which in this case is ES Alarm. Then with the alarm selected, I click the Add to Dashboard button.
The Add to dashboard dialog box will open, allowing me to select my CloudWatchBlog dashboard. Additionally, I can select the widget type I would like to use for the display of my alarm. For the ES Alarm, I will choose the Line widget and complete the process of adding this alarm to my dashboard by clicking the Add to dashboard button.
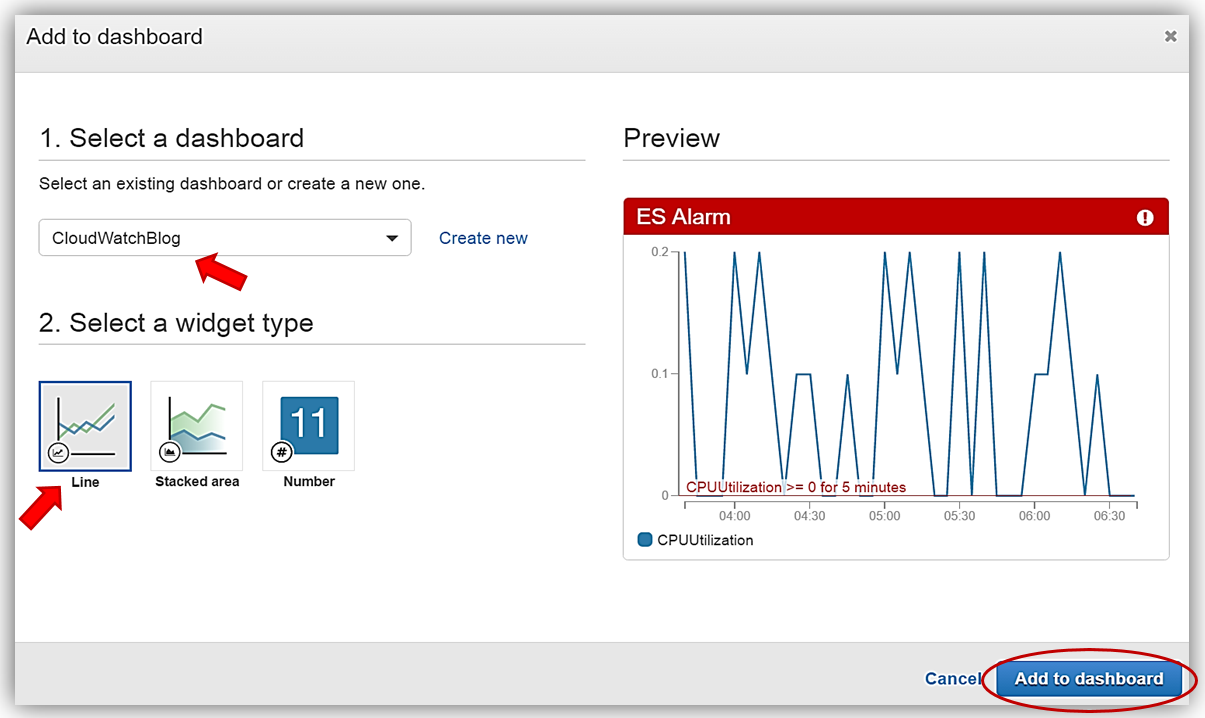
Upon successfully adding ES Alarm to the CloudWatchBlog dashboard, you will see a confirmation notice displayed in the CloudWatch console.

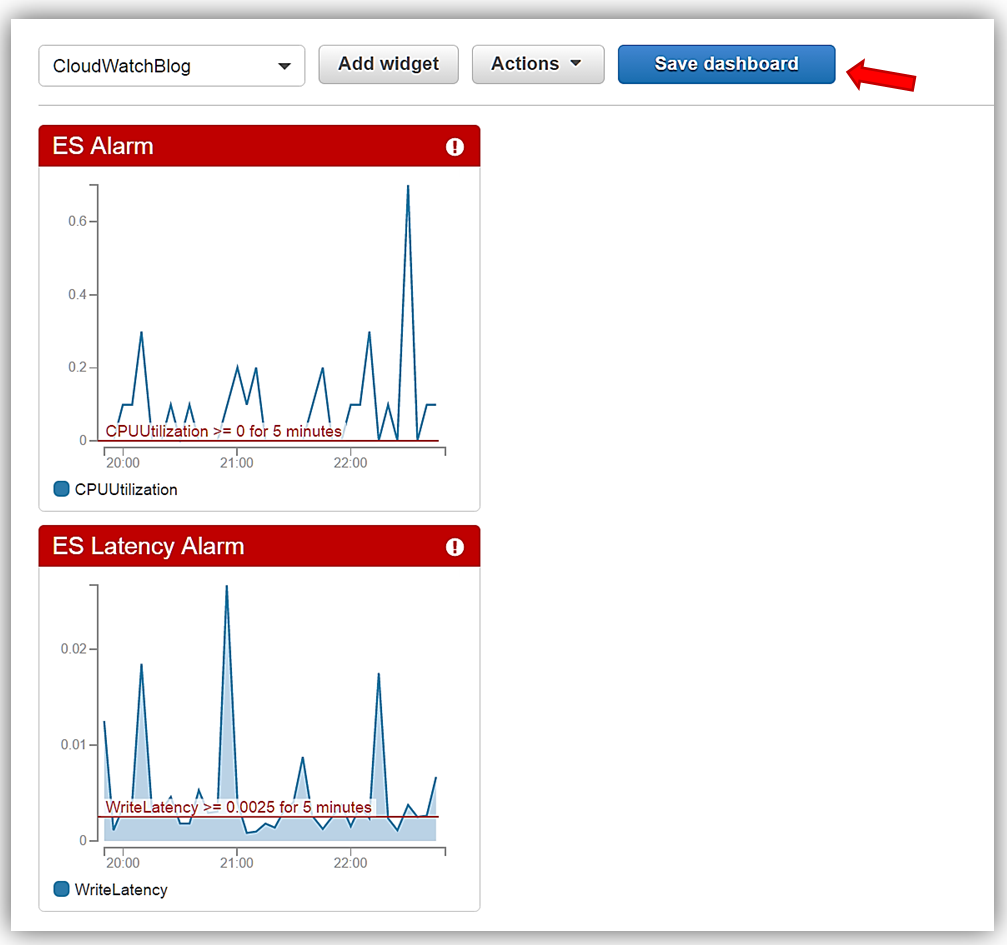
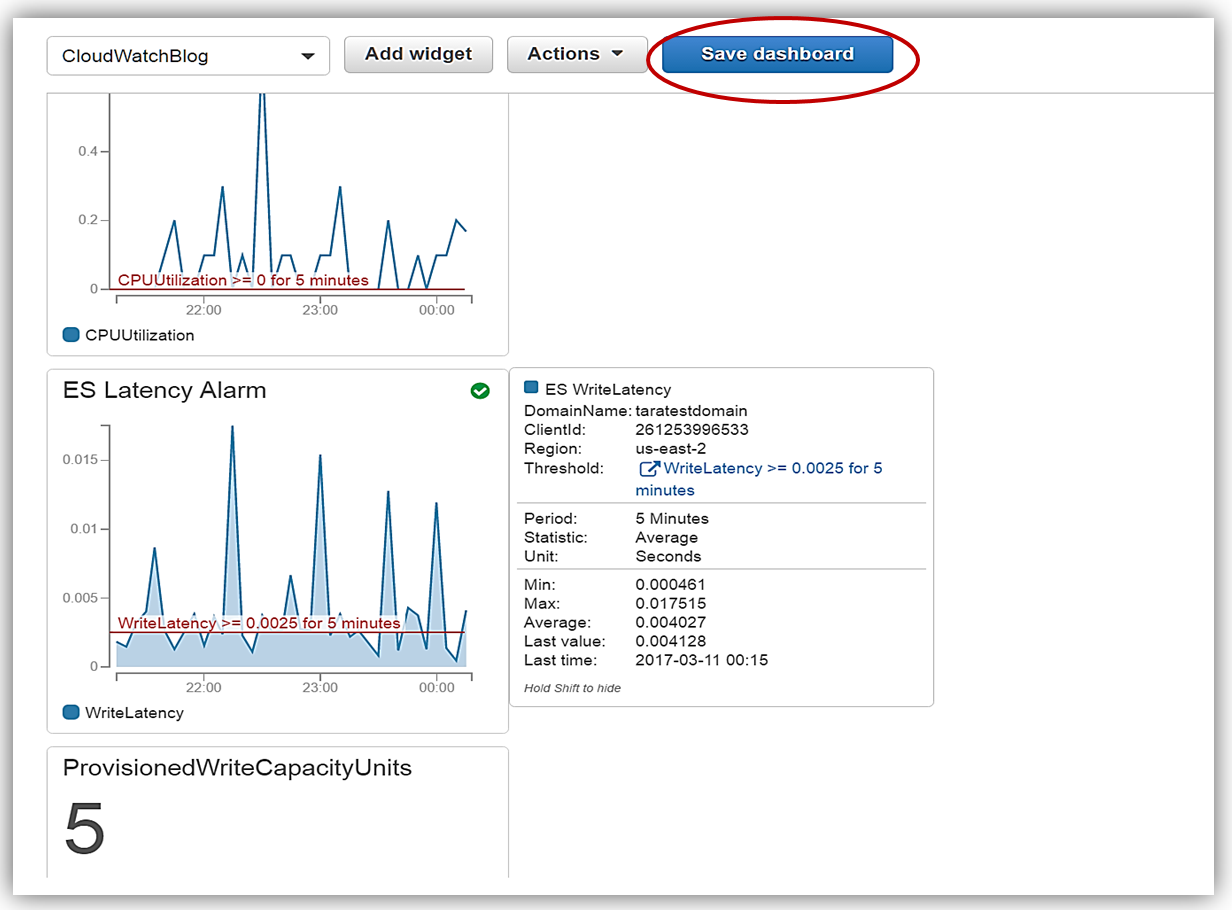
If I then go to the Dashboard section of the console and select my CloudWatchBlog dashboard, I will see the line widget for my alarm, ES Alarm, on the dashboard. To ensure that my ES Alarm widget is a permanent part of the dashboard, I will click the Save dashboard button to preserve the addition of this widget on the dashboard.

As we discussed, one of the benefits of utilizing a CloudWatch dashboard is the ability to add several alarms from various regions onto a dashboard. Since my scenario is leveraging my dashboard as a troubleshooting mechanism for my Elasticsearch solution, I would like to have several alarms and metrics related to my solution displayed on the CloudWatchBlog dashboard. Given this, I will create another alarm for my Elasticsearch instance and add it to my dashboard.
I will first return to the Alarms section of the console and click the Create Alarm button.

The Create Alarm dialog box is displayed showing all of the current metrics available in this region. From the summary, I can quickly see that there are 21 metrics being tracked for Elasticsearch. I will click on the ES Metrics link to view the individual metrics that can be used to create my alarm.
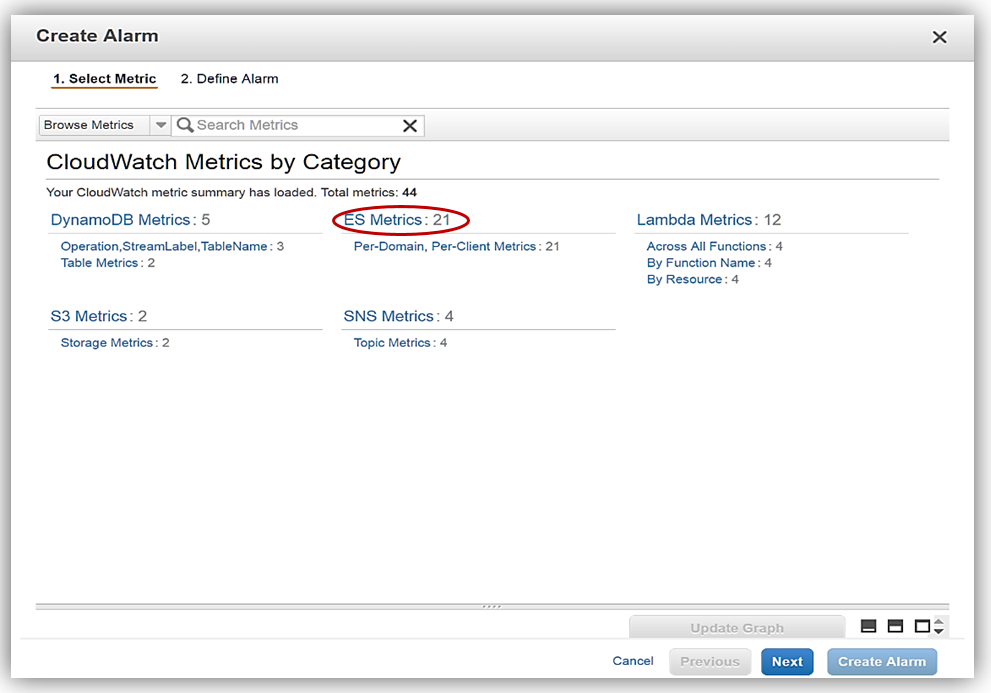
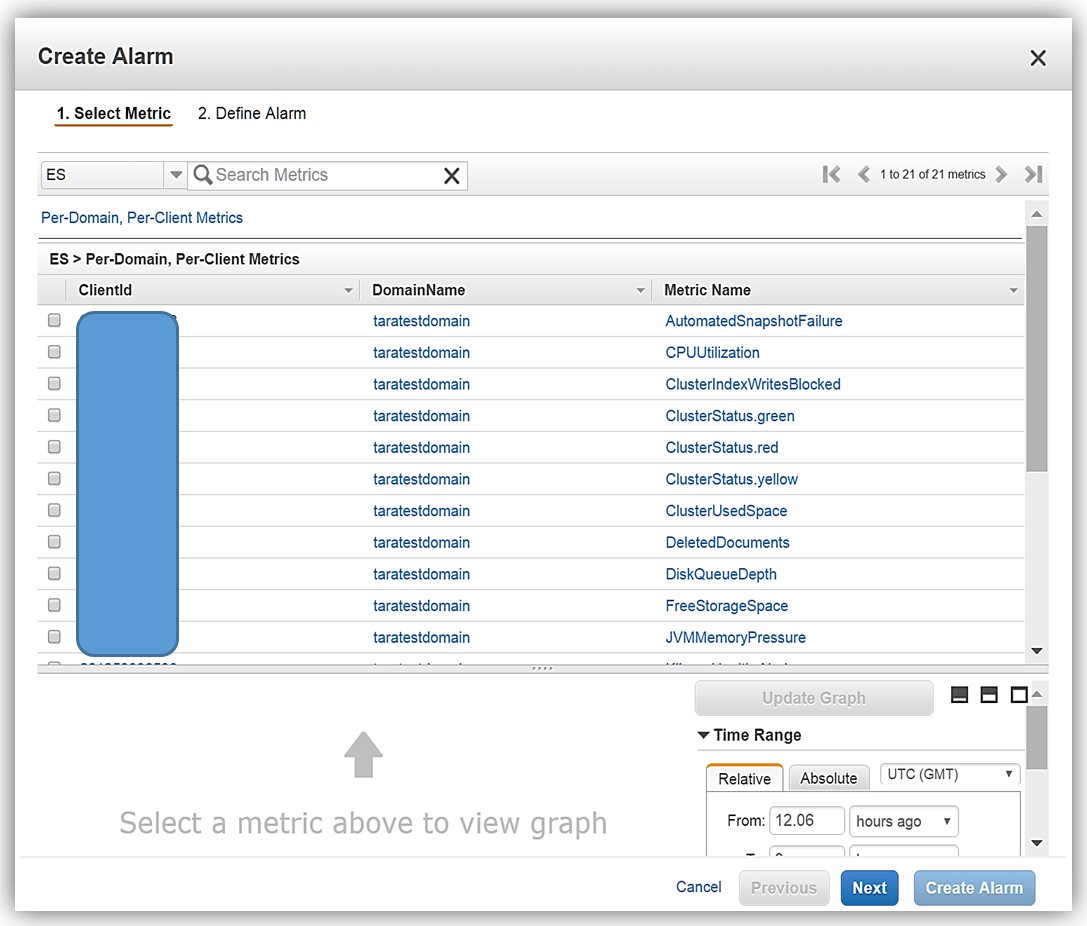
I can review the individual metrics shown for my Elasticsearch instance, and choose which metric I want to base my new alarm on. In this case, I choose the WriteLatency metric by selecting the checkbox for this metric and then click the Next button.
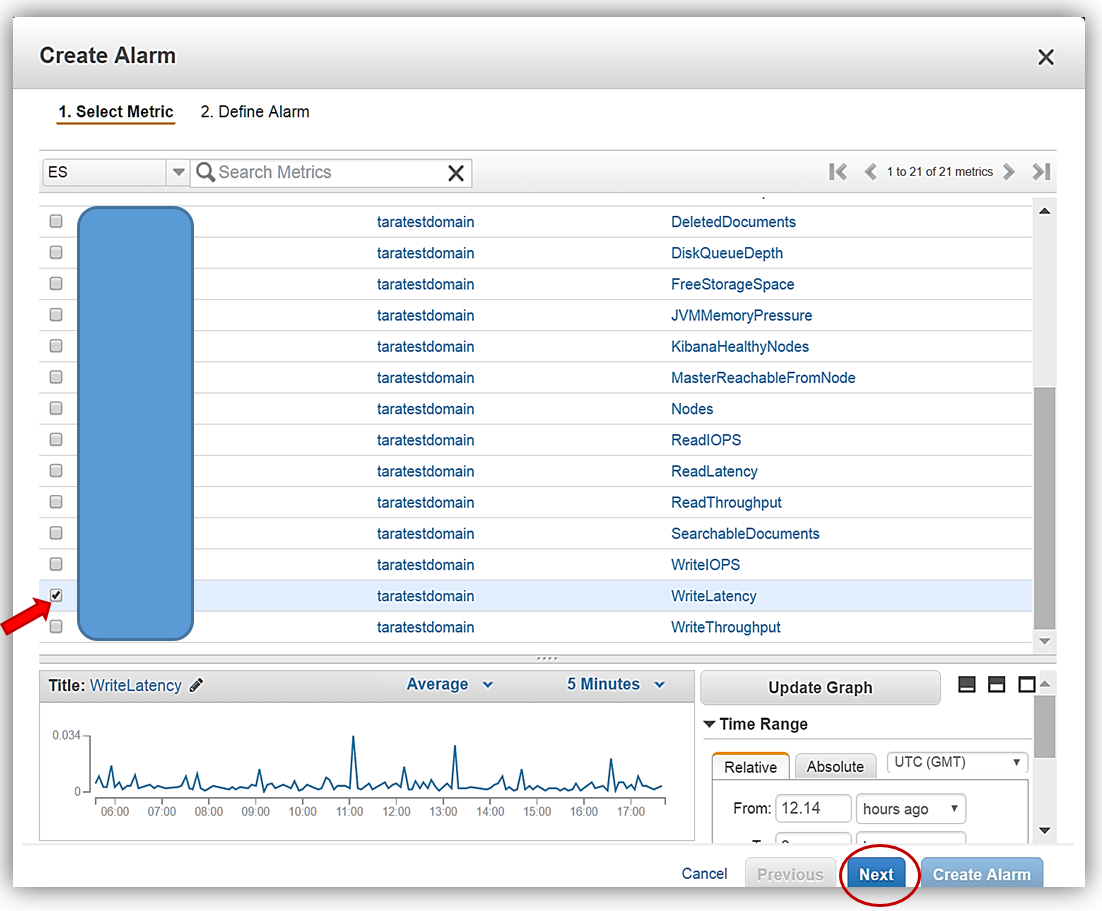
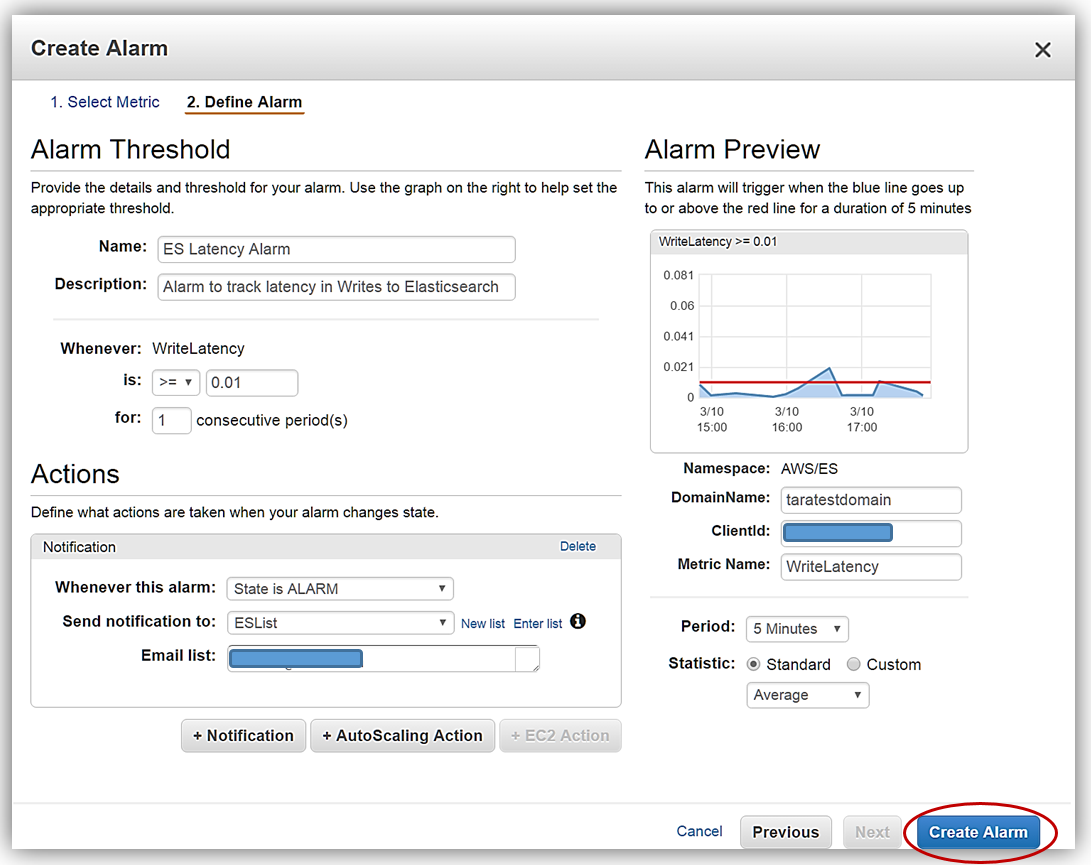
The next screen is where I fill in all the details about my alarm: name, description, alarm threshold, time period, and alarm action. I will name my new alarm, ES Latency Alarm, and complete the rest of the aforementioned data fields. To complete the creation of my new alarm, I click the Create Alarm button.
I will see a confirmation message box at the top of the Alarms console upon successful completion of adding the alarm, and the status of the newly created alarm will be displayed in the alarms list.

Now I will add my ES Latency Alarm to my CloudWatchBlog dashboard. Again, I click on the checkbox by the alarm and then click the Add to Dashboard button.
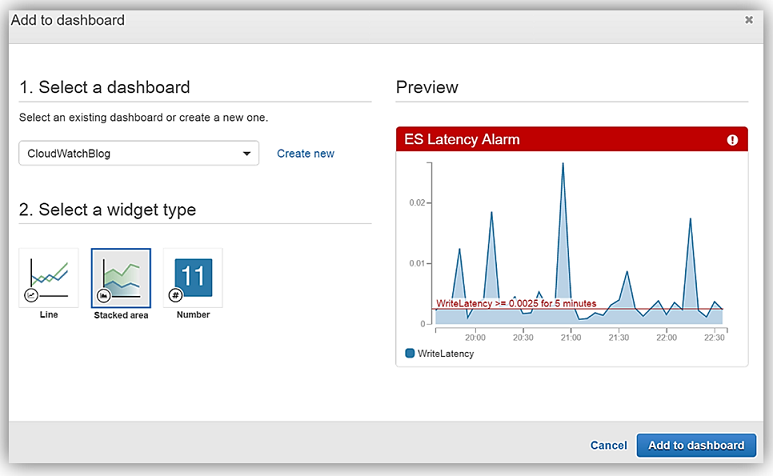
This time when the Add to Dashboard dialog comes up, I will choose the Stacked area widget to display the ES Latency Alarm on my CloudWatchBlog dashboard. Clicking the Add to Dashboard button will complete the addition of my ES Latency Alarm widget to the dashboard.
Once back in the console, again I will see the confirmation noting the successful addition of the widget. I go to the Dashboards and click on the CloudWatchBlog dashboard and I can now view the two widgets in my dashboard. To include this widget in the dashboard permanently, I click the Save dashboard button.
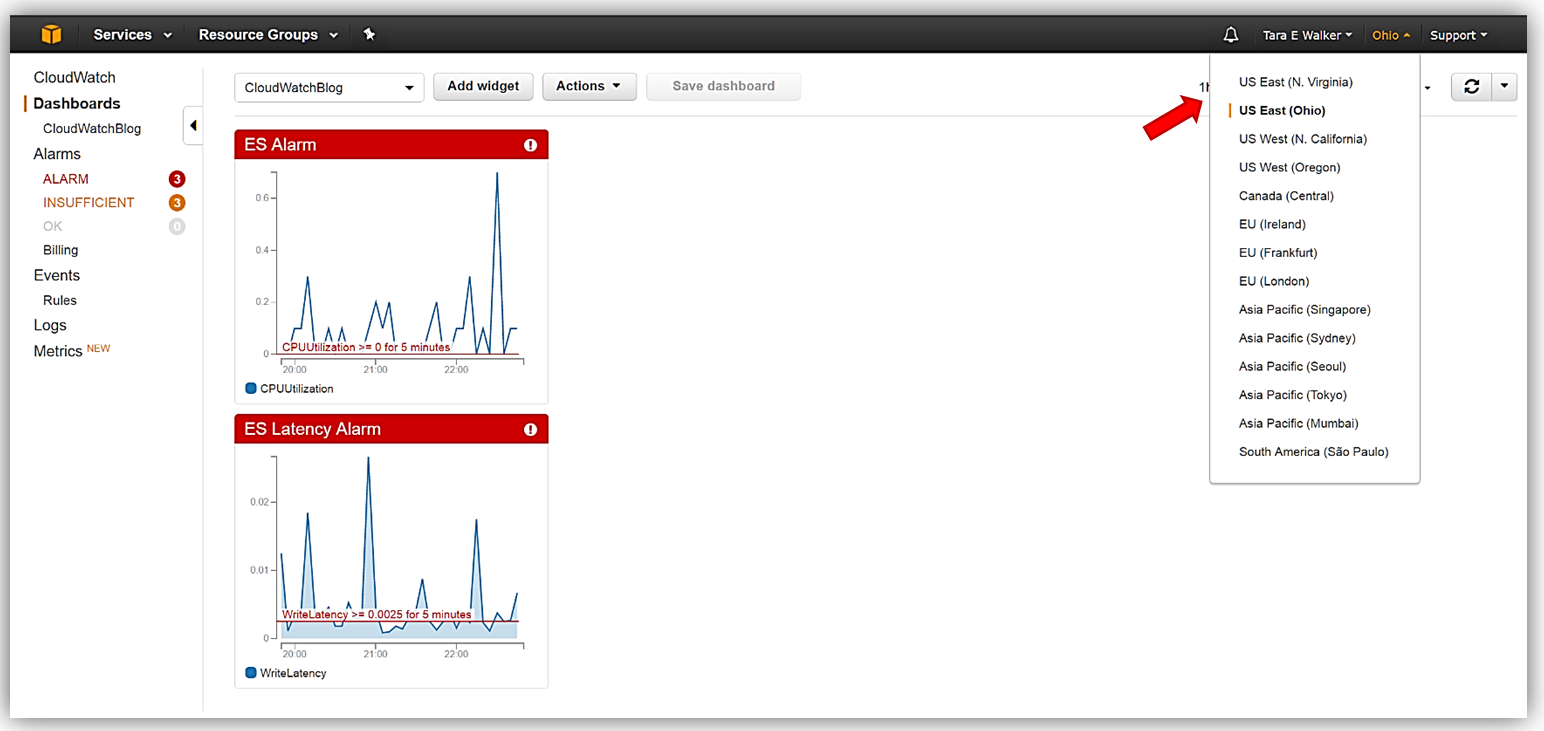
The final thing to note about the new CloudWatch feature, Alarms on Dashboards, is that alarms and metrics from other regions can be added to the dashboard for a complete view for troubleshooting. Let’s add a metric to the dashboard with the alarms widget.
Within the console, I will move from my current region, US East (Ohio), to the US East (N. Virginia) region.
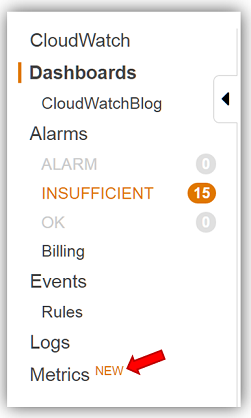
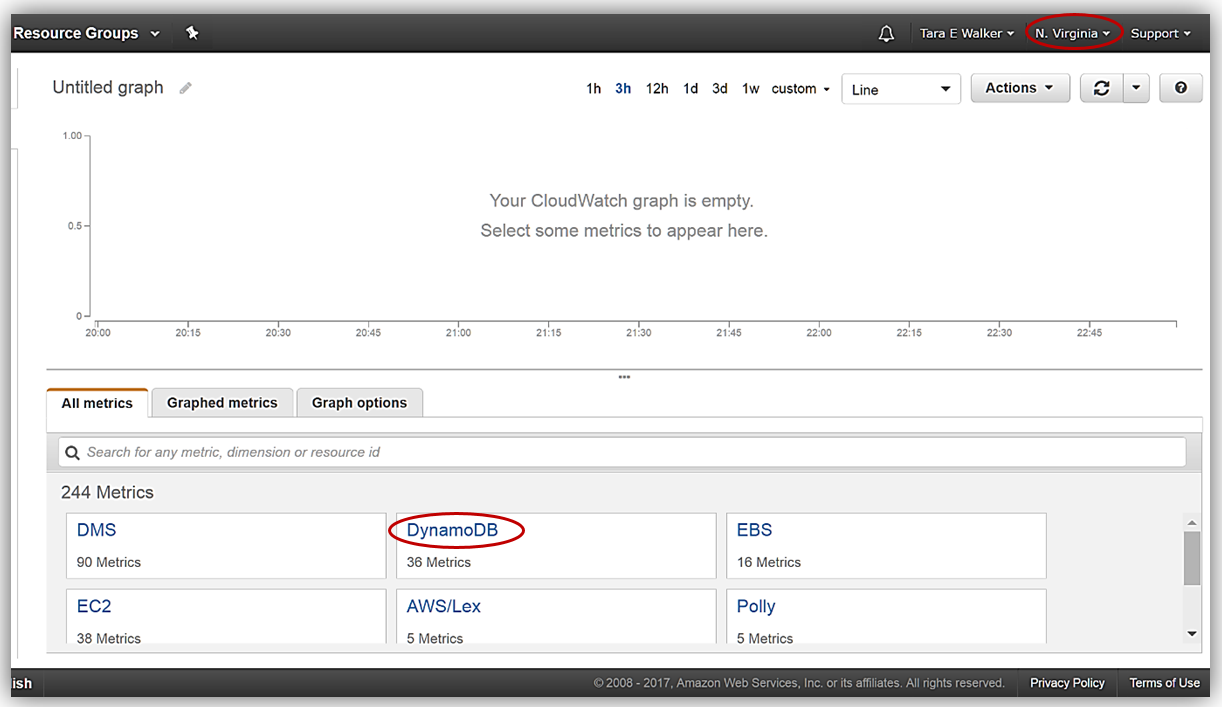
Now I will go to the Metric section of the CloudWatch console. This section displays the metrics from services used in the US East (N. Virginia) region.
My Elasticsearch solution triggers Lambda functions to capture all of the EmployeeInfo DynamoDB database CRUD (Create, Read, Update, Delete) changes via DynamoDB streams and write those changes into my Elasticsearch domain, taratestdomain. Therefore, I will add metrics to my CloudWatchBlog dashboard to track table metrics from DynamoDB.

Therefore, I am going to add the EmployeeInfo database ProvisionedWriteCapacityUnits metric to my CloudWatchBlog dashboard.
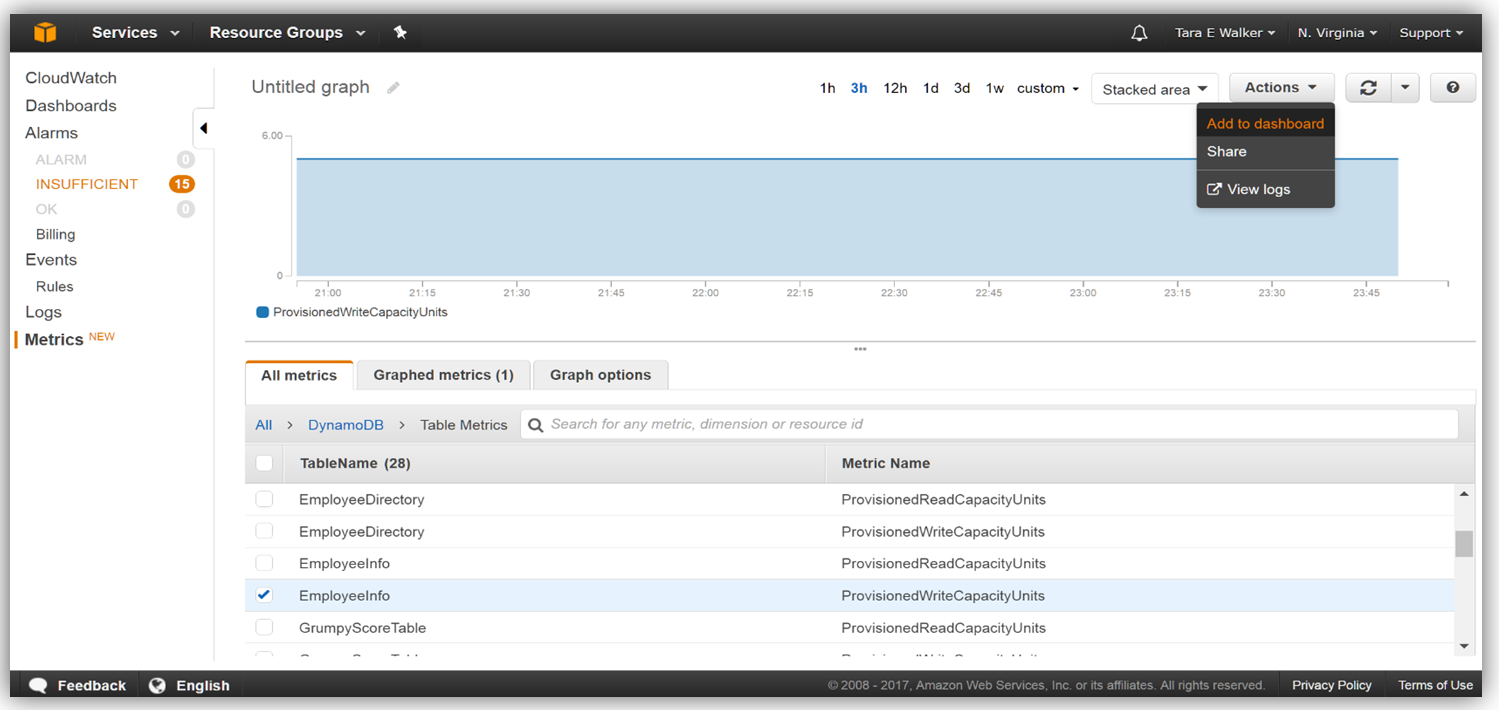
Back again in the Add to Dashboard dialog, I will select my CloudWatchBlog dashboard and choose to display this metric using the Number widget.
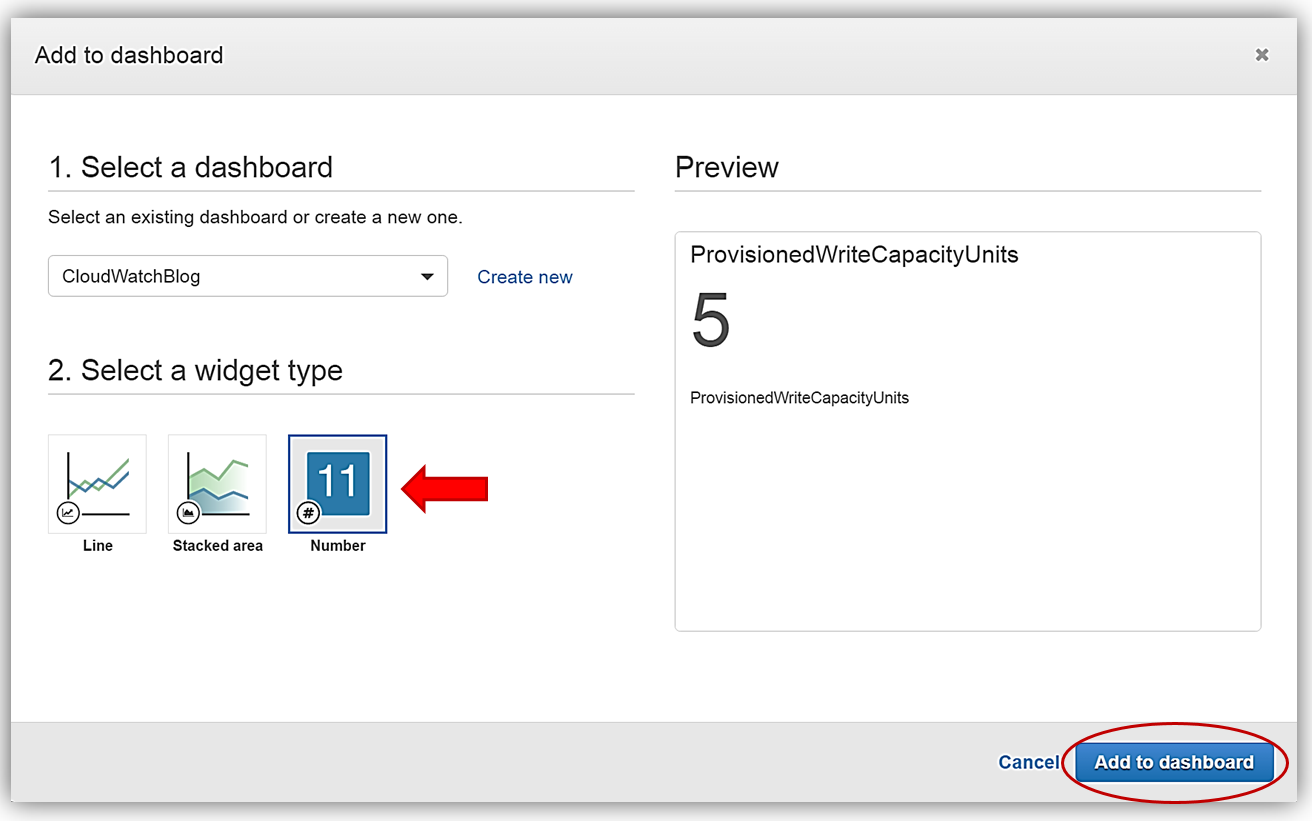
Now, the ProvisionedWriteCapacityUnits metric from the US East (N. Virginia) is displayed in the CloudWatchBlog dashboard with the Number widget added to the dashboard to with the alarms from the US East (Ohio). To make this update permanent in the dashboard, I will (you guessed it!) click the Save dashboard button.
Summary
Getting started with alarms on dashboards is easy. You can use alarms on dashboards across regions for another means of proactively monitoring alarms, build troubleshooting playbooks, and view desired metrics. You can also choose the metric first in the Metric UI and then change the type of widget according to the visualization that fits the metric.
Alarms on Dashboards are supported on Line, Stacked Area, and Number widgets. In addition, you can use Text widgets next to alarms on a dashboard to add steps or observations on how to handle changes in the alarm state. To learn more about Amazon CloudWatch widgets and about the additional dashboard widgets, visit the Amazon CloudWatch documentation and the CloudWatch Getting Started guide.
– Tara
