AWS DevOps & Developer Productivity Blog
Category: Java
CICD on Serverless Applications using AWS CodeArtifact
Developing and deploying applications rapidly to users requires a working pipeline that accepts the user code (usually via a Git repository). AWS CodeArtifact was announced in 2020. It’s a secure and scalable artifact management product that easily integrates with other AWS products and services. CodeArtifact allows you to publish, store, and view packages, list package […]
Building a centralized Amazon CodeGuru Profiler dashboard for multi-account scenarios
This post shows you how to configure CodeGuru Profiler to collect multiple applications’ profiling data into a central account and review the applications’ performance data on one dashboard.
Introducing new self-paced courses to improve Java and Python code quality with Amazon CodeGuru
This post announces the availability of new self-paced where you learn how to use CodeGuru Reviewer to automatically scan your code base, identify hard-to-find bugs and vulnerabilities, and get recommendations for fixing the bugs and security issues.
Understanding memory usage in your Java application with Amazon CodeGuru Profiler
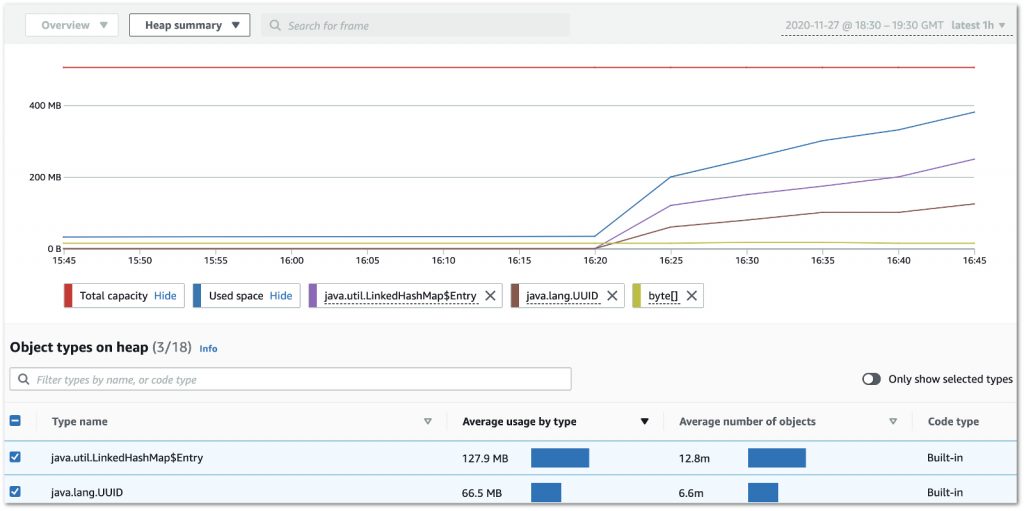
“Where has all that free memory gone?” This is the question we ask ourselves every time our application emits that dreaded OutOfMemoryError just before it crashes. Amazon CodeGuru Profiler can help you find the answer. Thanks to its brand-new memory profiling capabilities, troubleshooting and resolving memory issues in Java applications (or almost anything that runs […]
Resource leak detection in Amazon CodeGuru Reviewer
The resource leak detector in CodeGuru Reviewer combines static code analysis algorithms with machine learning to surface only the high confidence leaks. It has a high developer acceptance rate and has alerted developers within Amazon to thousands of leaks before those leaks hit production.


